TradeChartist Tracker™𝗧𝗿𝗮𝗱𝗲𝗖𝗵𝗮𝗿𝘁𝗶𝘀𝘁 𝗧𝗿𝗮𝗰𝗸𝗲𝗿 is an essential real-time multi Indicator tracking toolkit that can be plotted as a standalone Indicator plot, a multi symbol tracker/screener for upto 10 different symbols and a visual scorecard for upto 5 different symbols. The indicators included in the tracker are Stochastic Oscillator, RSI, CCI, 15 different Moving Averages, MACD, Bollinger Bands %B (including Bollinger Bands and Breakout Signals), Ichimoku Cloud (including Breakout signals), Donchian Channels Oscillator (including Donchian Channels and Breakout Signals), Net Volume and Heikin Ashi Trend.
===================================================================================================================
™𝗧𝗿𝗮𝗱𝗲𝗖𝗵𝗮𝗿𝘁𝗶𝘀𝘁 𝗧𝗿𝗮𝗰𝗸𝗲𝗿 𝗨𝘀𝗲𝗿 𝗠𝗮𝗻𝘂𝗮𝗹
=====================================
™TradeChartist Tracker Plot Types
==============================
1. Indicator plot of Chart Symbol on its own , chosen from the 𝗜𝗻𝗱𝗶𝗰𝗮𝘁𝗼𝗿 𝗧𝘆𝗽𝗲 dropdown, enabling 𝐃𝐢𝐬𝐩𝐥𝐚𝐲 𝐈𝐧𝐝𝐢𝐜𝐚𝐭𝐨𝐫 𝐏𝐥𝐨𝐭 (𝐝𝐢𝐬𝐚𝐛𝐥𝐞𝐬 𝐓𝐫𝐚𝐜𝐤𝐞𝐫/𝐒𝐜𝐨𝐫𝐞𝐜𝐚𝐫𝐝).
In this example Daily chart of XRP-USDT, 55 period Stochastic is tracked for the chart symbol XRP-USDT.
2. Indicator plot of a Symbol different from the Chart Symbol , chosen from the 𝗜𝗻𝗱𝗶𝗰𝗮𝘁𝗼𝗿 𝗧𝘆𝗽𝗲 dropdown by enabling Tʀᴀᴄᴋ ᴀɴᴏᴛʜᴇʀ Sʏᴍʙᴏʟ's Iɴᴅɪᴄᴀᴛᴏʀ and entering the symbol name in the Sʏᴍʙᴏʟ ᴛᴏ Tʀᴀᴄᴋ input box, whilst keeping 𝐃𝐢𝐬𝐩𝐥𝐚𝐲 𝐈𝐧𝐝𝐢𝐜𝐚𝐭𝐨𝐫 𝐏𝐥𝐨𝐭 (𝐝𝐢𝐬𝐚𝐛𝐥𝐞𝐬 𝐓𝐫𝐚𝐜𝐤𝐞𝐫/𝐒𝐜𝐨𝐫𝐞𝐜𝐚𝐫𝐝) enabled.
In this example Daily chart of XRP-USDT, 55 period Stochastic is tracked for the BTC-USD (different from chart symbol XRP-USDT).
3. Tracker Plot of up to 10 Multiple Symbol Trackers for the Indicator chosen from the 𝗜𝗻𝗱𝗶𝗰𝗮𝘁𝗼𝗿 𝗧𝘆𝗽𝗲 dropdown, by disabling 𝐃𝐢𝐬𝐩𝐥𝐚𝐲 𝐈𝐧𝐝𝐢𝐜𝐚𝐭𝐨𝐫 𝐏𝐥𝐨𝐭 (𝐝𝐢𝐬𝐚𝐛𝐥𝐞𝐬 𝐓𝐫𝐚𝐜𝐤𝐞𝐫/𝐒𝐜𝐨𝐫𝐞𝐜𝐚𝐫𝐝) and by entering the number of trackers required in the 𝐍𝐮𝐦𝐛𝐞𝐫 𝐨𝐟 𝐓𝐫𝐚𝐜𝐤𝐞𝐫𝐬 input box under 𝗧𝗿𝗮𝗰𝗸𝗲𝗿 𝗣𝗹𝗼𝘁𝘀 section. Upto 10 Symbols can be tracked and can be input by the user in the input boxes from Sʏᴍʙᴏʟ 1,...Sʏᴍʙᴏʟ 10 . 𝐃𝐢𝐬𝐩𝐥𝐚𝐲 𝐈𝐧𝐝𝐢𝐜𝐚𝐭𝐨𝐫 𝐏𝐥𝐨𝐭 (𝐝𝐢𝐬𝐚𝐛𝐥𝐞𝐬 𝐓𝐫𝐚𝐜𝐤𝐞𝐫/𝐒𝐜𝐨𝐫𝐞𝐜𝐚𝐫𝐝) must be disabled for this plot type.
In this example Daily chart of Crypto Total Market Cap, Bollinger Bands %B is tracked for the chart symbol + 10 other Crypto symbols using Multi Symbol Trackers
4. Visual Scorecards of up to 5 Symbols for 8 indicators (all except Net Volume and HA Trend) can be plotted with real-time data by enabling 𝗗𝗶𝘀𝗽𝗹𝗮𝘆 𝗩𝗶𝘀𝘂𝗮𝗹 𝗦𝗰𝗼𝗿𝗲𝗰𝗮𝗿𝗱 - (𝟓 𝐓𝐫𝐚𝐜𝐤𝐞𝐫𝐬 𝐋𝐢𝐦𝐢𝐭). 𝐃𝐢𝐬𝐩𝐥𝐚𝐲 𝐈𝐧𝐝𝐢𝐜𝐚𝐭𝐨𝐫 𝐏𝐥𝐨𝐭 (𝐝𝐢𝐬𝐚𝐛𝐥𝐞𝐬 𝐓𝐫𝐚𝐜𝐤𝐞𝐫/𝐒𝐜𝐨𝐫𝐞𝐜𝐚𝐫𝐝) must be disabled for this plot type.
For the same example Daily chart of Crypto Total Market Cap as above, Visual Scorecard is plotted for 5 Symbols as shown.
5. Indicator Tracker labels can be plotted on Price chart by overlaying the Tracker on main chart and by switching from Separate Tracker Pane - Default to Tracker Labels only on Price Scale in the Lᴀʙᴇʟs Dɪsᴘʟᴀʏ Tʏᴘᴇ dropdown box.
In this example chart of 1hr XLM-USDT, Tracker labels of 55 EMA are plotted for 10 different symbols along with the 55 EMA plot of XLM-USDT.
Indicator plot that doesn't fit on price scale can be visualised using a second Tracker added to chart as shown in the ETH-USDT example below tracking Net Volume.
===================================================================================================================
𝗜𝗻𝗱𝗶𝗰𝗮𝘁𝗼𝗿𝘀 𝗜𝗻𝗰𝗹𝘂𝗱𝗲𝗱 𝗶𝗻 ™𝗧𝗿𝗮𝗱𝗲𝗖𝗵𝗮𝗿𝘁𝗶𝘀𝘁 𝗧𝗿𝗮𝗰𝗸𝗲𝗿
==============================================
1. Stochastic Oscillator
2. RSI
3. CCI
4. MA - (15 types included)
5. MACD
6. Bollinger Bands %B + Optional plots of Bollinger Bands and Breakout Signals
7. Ichimoku Cloud Oscillator + Optional plots of Ichimoku Cloud and Breakout Signals
8. Donchian Channels + Optional plots of Donchian Channels and Breakout Signals
9. Net Volume
10. Heikin Ashi Trend
All of the above indicators can be plotted as independent plots of the Chart Symbol or of a different symbol by enabling 𝐃𝐢𝐬𝐩𝐥𝐚𝐲 𝐈𝐧𝐝𝐢𝐜𝐚𝐭𝐨𝐫 𝐏𝐥𝐨𝐭 (𝐝𝐢𝐬𝐚𝐛𝐥𝐞𝐬 𝐓𝐫𝐚𝐜𝐤𝐞𝐫/𝐒𝐜𝐨𝐫𝐞𝐜𝐚𝐫𝐝). Some Oscillators have the option of Pʟᴏᴛ Sᴛʏʟᴇ under their relevant sections, and can be plotted as line, area or a histogram.
Oscillators 1-8 (except 4) require source price, lookback length and smoothing (where available) for the indicator plot. The colour of the tracker blocks is based on the Upper/Lower bands (where available), specified by the user in the respective sections. For example, if the RSI indicator is chosen to be plotted with Upper band at 60 and Lower band at 40, the tracker blocks and the Indicator plot paint the values between 40 and 60 in neutral colour which can be changed from the settings.
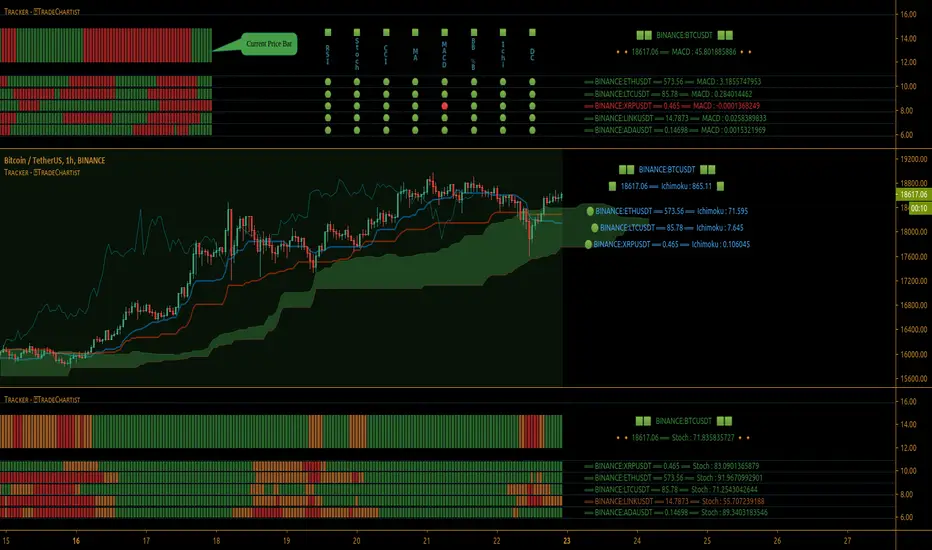
Multi Window BTC-USDT 1hr example chart below with various indicators from ™TradeChartist Tracker.
Note: The tracker colour is exactly colour of the Indicator Plot. The Visual Scorecard , however uses the mid values and doesn't take into account the bands specified by the user. For example, RSI score is green on the Visual Scorecard as long as RSI is above 50 and doesn't get affected by the user specified upper/lower band and this applies to all Oscillators. This is shown in the 1hr BTC-USDT chart below.
Moving Averages (MA) and MACD
------------------------------------------------------
Tracker plots and tracks one of 15 Moving Averages that can be chosen from the MA ᴛʏᴘᴇ and by specifying the MA Lᴇɴɢᴛʜ .
MACD uses EMA as default for calculating the MACD plots and Tracker data using Fᴀsᴛ Lᴇɴɢᴛʜ , Sʟᴏᴡ Lᴇɴɢᴛʜ and Sᴍᴏᴏᴛʜɪɴɢ . To experiment or use a different Moving Average to calculate MACD, disable 𝐔𝐬𝐞 𝐄𝐌𝐀 (Uɴᴄʜᴇᴄᴋ ᴛᴏ ᴜsᴇ MA ғʀᴏᴍ ᴀʙᴏᴠᴇ) and select the required Moving Average from MA ᴛʏᴘᴇ drop down of the 𝟰. 𝗠𝗼𝘃𝗶𝗻𝗴 𝗔𝘃𝗲𝗿𝗮𝗴𝗲 section.
Bollinger Bands %B + Optional plots of Bollinger Bands and Breakout Signals
---------------------------------------------------------------------------------------------------------------------------
Bollinger Bands %B is a companion oscillator for Bollinger Bands and helps depict where the price is, in relation to the Bollinger Bands. To plot the actual Bollinger Bands, enable Dɪsᴘʟᴀʏ Bᴏʟʟɪɴɢᴇʀ Bᴀɴᴅs and to plot the Bollinger Bands Breakout Signals, enable Sʜᴏᴡ BB Bʀᴇᴀᴋᴏᴜᴛ Sɪɢɴᴀʟs , with 𝐃𝐢𝐬𝐩𝐥𝐚𝐲 𝐈𝐧𝐝𝐢𝐜𝐚𝐭𝐨𝐫 𝐏𝐥𝐨𝐭 (𝐝𝐢𝐬𝐚𝐛𝐥𝐞𝐬 𝐓𝐫𝐚𝐜𝐤𝐞𝐫/𝐒𝐜𝐨𝐫𝐞𝐜𝐚𝐫𝐝) enabled.
Ichimoku Cloud Oscillator + Optional plots of Ichimoku Cloud and Breakout Signals
------------------------------------------------------------------------------------------------------------------------------------
Ichimoku Cloud Oscillator helps visualize the current price in relation to the breakout support/resistance of the Ichimoku Cloud using strict Ichimoku Cloud criteria (including Chikou Span agreeing with the breakout etc.). To plot the actual Ichimoku Cloud, enable Dɪsᴘʟᴀʏ Iᴄʜɪᴍᴏᴋᴜ Cʟᴏᴜᴅ and to plot the Kumo Breakout Signals, enable Sʜᴏᴡ Kᴜᴍᴏ Bʀᴇᴀᴋᴏᴜᴛ Sɪɢɴᴀʟs , with 𝐃𝐢𝐬𝐩𝐥𝐚𝐲 𝐈𝐧𝐝𝐢𝐜𝐚𝐭𝐨𝐫 𝐏𝐥𝐨𝐭 (𝐝𝐢𝐬𝐚𝐛𝐥𝐞𝐬 𝐓𝐫𝐚𝐜𝐤𝐞𝐫/𝐒𝐜𝐨𝐫𝐞𝐜𝐚𝐫𝐝) enabled.
Cloud Settings form the fundamental factor for this indicator to detect the breakouts. The settings for the Ichimoku Cloud is Automatic (detects right settings for the symbol type) by default, but this can be changed to Classic or 24/7 Crypto , based on the user preference from the settings under 𝐂𝐥𝐨𝐮𝐝 𝐓𝐲𝐩𝐞, which also includes a manual input option. Ichimoku traders can experiment different settings combinations under manual settings to suit their trading frequency and timeframe traded.
Donchian Channels + Optional plots of Donchian Channels and Breakout Signals
-------------------------------------------------------------------------------------------------------------------------------
Donchian Channels comprises of three plots - a upper band, a lower band and a mean line (or mid line of the channel). The upper band is based on highest high of N periods specified by the user and the lower band is based on the lowest low of N periods specified by the user. These channels help spot price breaching high or low of last N periods clearly, thereby aiding the trader to understand the price action of any symbol better on any given timeframe.
Donchian Channels Oscillator helps visualize the current price in relation to the Mean line of the Donchian Channels of user specified lookback period (specified in the Dᴏɴᴄʜɪᴀɴ Cʜᴀɴɴᴇʟ Lᴇɴɢᴛʜ input box). The sensitivity of the oscillator can be adjusted using smoothing factor in the Sᴍᴏᴏᴛʜɪɴɢ input box. To plot the actual Donchian Channels, enable Dɪsᴘʟᴀʏ Dᴏɴᴄʜɪᴀɴ Cʜᴀɴɴᴇʟs and to plot the Donchian Channels Breakout Signals, enable Sʜᴏᴡ DC Bʀᴇᴀᴋᴏᴜᴛ Sɪɢɴᴀʟs , with 𝐃𝐢𝐬𝐩𝐥𝐚𝐲 𝐈𝐧𝐝𝐢𝐜𝐚𝐭𝐨𝐫 𝐏𝐥𝐨𝐭 (𝐝𝐢𝐬𝐚𝐛𝐥𝐞𝐬 𝐓𝐫𝐚𝐜𝐤𝐞𝐫/𝐒𝐜𝐨𝐫𝐞𝐜𝐚𝐫𝐝) enabled.
Note: Using smoothing factor more than 1 doesn't reflect the actual Donchian Channels Mean line and also impacts the Tracker block colours.
Net Volume and Heikin Ashi Trend
-------------------------------------------------------
Net Volume and Heikin Ashi Trend can be tracked and plotted for up to 10 symbols in addition to the chart symbol, but both Net Volume and Heikin Ashi Trend are not included in the Visual Scorecard. Since the colour of the Net Volume depends on candle being bullish or bearish, it can help the user visualize if the current candle close of the symbol tracked is above or below the symbols's candle open.
Note: Bar Replay doesn't update the bar by bar indicator plot for historic bars for symbols other than the chart symbol. However, the Indicator Plot is perfectly usable for the realtime bar as data updates for both the Trackers and the Scorecard in realtime.
===================================================================================================================
𝗩𝗶𝘀𝘂𝗮𝗹 𝗦𝗰𝗼𝗿𝗲𝗰𝗮𝗿𝗱
=================
Visual Scorecard plots a green Bull or a red Bear Score colour plot for each Indicator from RSI to Donchian Channels Oscillator against every symbol tracked for up to 5 symbols max (First 5 symbols under 𝗧𝗿𝗮𝗰𝗸𝗲𝗿 𝗣𝗹𝗼𝘁𝘀 section). The gap between the scores can be adjusted using gap factor under Gᴀᴘ Fᴀᴄᴛᴏʀ ʙᴇᴛᴡᴇᴇɴ Sᴄᴏʀᴇs dropdown.
Visual Scorecard scoring method
----------------------------------------------------
RSI > 50 - 🟢
RSI < 50 - 🔴
Stoch > 50 - 🟢
Stoch < 50 - 🔴
CCI > 0 - 🟢
CCI < 0 - 🔴
Close price above MA plot - 🟢
Close price below MA plot - 🔴
MACD > 0 - 🟢
MACD < 0 - 🔴
Bollinger Bands %B > 50 - 🟢
Bollinger Bands %B < 50 - 🔴
Ichimoku Bullish Kumo Trend - 🟢
Ichimoku Bearish Kumo Trend - 🔴
Donchian Channels Oscillator > 0 (or close price above DC Mean Line) - 🟢
Donchian Channels Oscillator < 0 (or close price below DC Mean Line) - 🔴
Note: Bar Replay doesn't update the bar by bar scores/tracker data for historic bars for symbols other than the chart symbol. However, the Scorecard is perfectly usable for the realtime bar as data updates for both the Trackers and the Scorecard in realtime.
===================================================================================================================
𝗠𝘂𝗹𝘁𝗶 𝗦𝘆𝗺𝗯𝗼𝗹 𝗧𝗿𝗮𝗰𝗸𝗲𝗿𝘀/𝗟𝗮𝗯𝗲𝗹𝘀
=============================
Multi Symbol Tracker blocks continuously track the real-time indicator data of up to 10 symbols (in addition to the chart symbol) based on the number of Symbol Trackers preferred in the 𝐍𝐮𝐦𝐛𝐞𝐫 𝐨𝐟 𝐒𝐲𝐦𝐛𝐨𝐥 𝐓𝐫𝐚𝐜𝐤𝐞𝐫𝐬 (𝟎-𝟏𝟎) input box under the 𝗧𝗿𝗮𝗰𝗸𝗲𝗿 𝗣𝗹𝗼𝘁𝘀 section, and plots Bull, Bear and Neutral colour coded blocks based on both the indicator selected and settings preferred by the user under the relevant indicator section.
Multi Symbol Tracker Labels also continuously track the real-time indicator data in addition to the last close price (if 𝐒𝐡𝐨𝐰 𝐏𝐫𝐢𝐜𝐞 is enabled under 𝗧𝗿𝗮𝗰𝗸𝗲𝗿 𝗣𝗹𝗼𝘁𝘀 section), which helps user see the real-time changes in the indicator values and price changes of the symbols tracked.
The Tracker Label colours are exactly the same as the Tracker Block colours and are filtered based on the user preferred bands on the Oscillator values. This is slightly different to the Visual Scorecard Colour coding as the range between the user preferred bands is colour coded in a neutral colour, whereas the Scorecard uses only Bull and Bear Colours as explained in the 𝗩𝗶𝘀𝘂𝗮𝗹 𝗦𝗰𝗼𝗿𝗲𝗰𝗮𝗿𝗱 heading above. For example, if the user prefers RSI upper band of 60 and lower band of 40, the range between the values of 40 and 60 will be colour coded in neutral colour which can be changed from the 𝗨𝘀𝗲𝗳𝘂𝗹 𝗘𝘅𝘁𝗿𝗮𝘀 section of the indicator settings.
Note 1: Default settings are based on the Oscillator mid values and hence the Tracker Blocks match with the Visual Scorecard colour codes. Using Upper and Lower bands for oscillators help spot the oversold and overbought zones and also helps spot breakout threshold based on Indicator values specified by the user. Example chart with visual depiction below using RSI.
Note 2: Bar Replay doesn't update the bar by bar scores/tracker data for historic bars for symbols other than the chart symbol. However, the Tracker blocks/labels are perfectly usable for the realtime bar as data updates for both the Trackers and the Scorecard in realtime.
===================================================================================================================
Frequently Asked Questions
========================
Q: When I load the ™TradeChartist Tracker, why are the values in the labels blurred sometimes?
A: This happens occasionally as shown in the chart below, when the script is loaded for the first time or when a different setting is used.
To resolve this, just hide and unhide the script using the 👁 next to the Indicator title. If it is not visible, just hover the mouse/crosshair over the Indicator Title and it will be visible.
Q: Why does the indicator plot, tracker blocks and labels of Symbols being tracked, not update when I use Bar Replay?
A: As explained in the relevant sections above, historic data for bars and indicators other than chart symbol doesn't update on bar replay. But the chart symbol data does update for every bar on bar replay. This doesn't affect the real-time values and block colours for the symbols tracked.
Q: Can I track real-time values of a currently trading symbol when I'm on a symbol chart that is inactive? For example, can I see labels with real-time BTC values on a Sunday when I'm on a SPX chart when its not in session?
A: Simple answer is no. This is because, the plots are based on bar times of the chart and the symbols are tracked based on the bar time. So if the SPX session ended on Friday, the last known value of the BTC labels will be from Friday and hence it is always recommended to track symbols from a symbol chart that is in session.
Q: Does ™TradeChartist Tracker repaint?
A: This indicator doesn't repaint but it is not recommended to trade a different symbol from the chart based on the real-time data alone without checking if the current symbol chart is in session as inactive price chart will not have updated data on symbols tracked. Also, bar replay doesn't work on data pulled from external symbol data than the chart symbol, but signals confirmed at candle close and confirmed by Tracker blocks with appropriate colour code will be in agreement with the respective indicator and can be double checked for building trust and confidence on the indicator.
Q: Can ™TradeChartist Tracker be connected to other indicators as external source?
A: Yes. ™TradeChartist Tracker can be connected to another script and there are several use cases in doing so. A couple of examples are shown below.
1. ™TradeChartist Tracker 's Bollinger Bands %B 𝗜𝗻𝗱𝗶𝗰𝗮𝘁𝗼𝗿 𝗣𝗹𝗼𝘁 connected to ™TradeChartist Plotter to plot Divergences on the 4hr XAU-USD main price chart.
2. ™TradeChartist Tracker 's 𝐁𝐫𝐞𝐚𝐤𝐨𝐮𝐭 𝐓𝐫𝐞𝐧𝐝 𝐈𝐝𝐞𝐧𝐭𝐢𝐟𝐢𝐞𝐫 connected to ™TradeChartist Plug and Trade as Oscillatory Signal with 0/0 to generate trade signals with Targets and performance information on trades.
More Example Charts
==================
===================================================================================================================
Best Practice: Test with different settings first using Paper Trades before trading with real money
===================================================================================================================
This is not a free to use indicator. Get in touch with me (PM me directly if you would like trial access to test the indicator)
Premium Scripts - Trial access and Information
Trial access offered on all Premium scripts.
PM me directly to request trial access to the scripts or for more information.
===================================================================================================================
在脚本中搜索"THE SCRIPT"
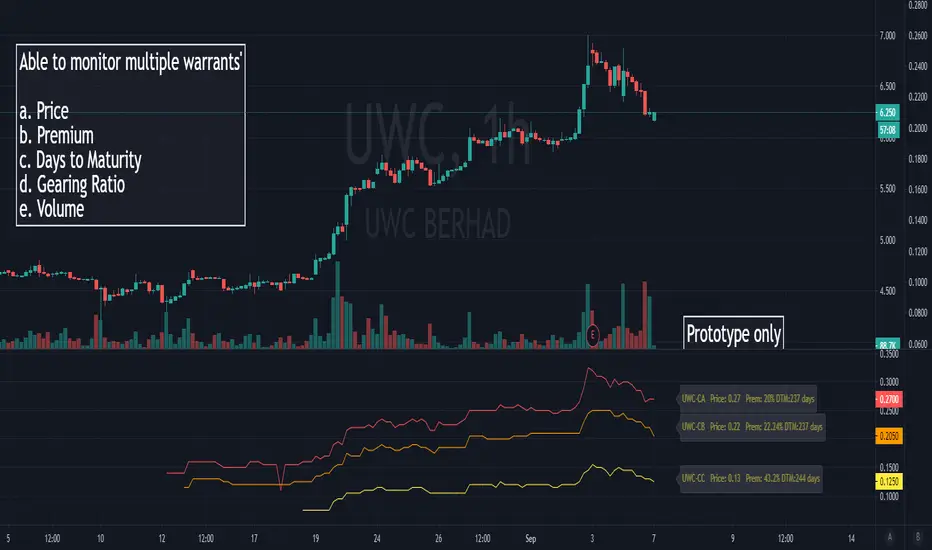
Malaysia Structured Warrants (Local Equities) ScreenerThis is an indicator script that showed the various performance of numerous companies call/put warrants that was issued by investment bank and institutions with limited numbers of warrants showed within the script.
This script was built to monitor and observe the past and current trend on all of the call/put warrants linked securities listed in Bursa Malaysia in term of the premium percentage , gearing ratio , unit price , periodic volume and time to maturity (still under process).
Besides, it was built to utilize users time to review the basic data regarding with those call/put warrants as the script will show numbers of them instead of requiring changing on graph to observe each basic data.
To simplify it , it is somehow like the KLSE Screener Warrant Side but this script has all the previous records and data that can be view in glance and download in the format of CSV (only in premium account).
To example used is UWC , but this script can apply to any malaysia stock that have the call warrants (like SUPERMX , MYEG , MI, FGV ,TOPGLOV and etc.)
It is still a prototype and manual update with newly issued of call/put warrants are required to add within this script time by time. There are also few technical issues regarding with this scripts as the labels are most times which i have contact with the customer service regarding this problem.
Overall, I speak as the author and copyright owner of this scripts, this script wouldn’t update by itself when new relevant structured warrants are issued but the update should provide based on my personal time planning.
Author : J.L.Z.H
You are free to leave your tradingview id below if you like to have a few days of access permission.
TradeChartist TrendRider Companion ™TradeChartist TrendRider Companion is an exceptionally beautiful and a functional indicator that can be used as a companion with ™TradeChartist TrendRider or as a standalone indicator and can also be used with other scripts. The indicator plots the trend based on Momentum, Volatility , detecting critical zones of Support and Resistance along the way, which helps the indicator find the right trend to ride, plotting Trend Intensity and Trend Markers based on only one piece of User input - TrendRider Type (Aggressive, Normal or Laid Back).
===================================================================================================================
What does ™TradeChartist TrendRider Companion do?
TrendRider Companion plots Trend Intensity along with Bull and Bear Trend Markers on chart, which helps the user get a visual confirmation of the Trend.
TrendRider Companion paints Trend strength on price bars based on the Color Scheme, if this option is enabled from the indicator settings.
===================================================================================================================
The script is pretty straight forward to use on any chart to track the trend intensity. ™TradeChartist TrendRider uses the same logic to detect the trend but TrendRider also plots critical Support/Resistance zones, detecting any breaches or fail of those levels on a candle close before reversing the Trend Ride.
===================================================================================================================
Best Practice: Test with different settings first using Paper Trades before trading with real money
===================================================================================================================
This is not a free to use indicator. Get in touch with me (PM me directly if you would like trial access to test the indicator)
Premium Scripts - Trial access and Information
Trial access offered on all Premium scripts.
PM me directly to request trial access to the scripts or for more information.
===================================================================================================================

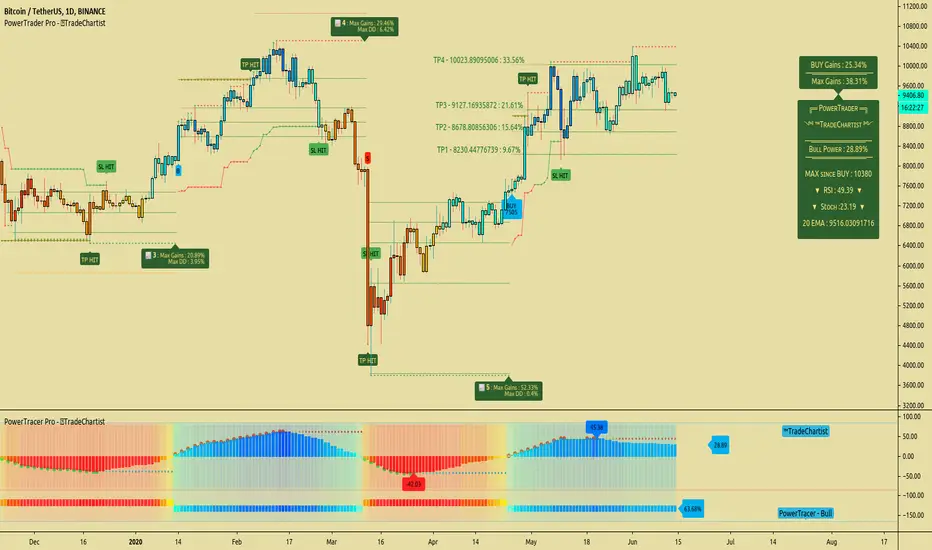
TradeChartist PowerTrader ProTradeChartist PowerTrader Pro is a versatile Signal generator and Signal plotter on the main price chart based on signals from other compatible scripts like TradeChartist PowerTracer Pro . This elegantly designed script plots the following based on user preference.
BUY and SELL signals based on external compatible signal source
Automatic Targets if opted from settings
Trailing or Fixed Stop Loss based on user input
Take Profit % and Quantity to trade based on user input
PowerTrader Dashboard displaying 14 period RSI, Stoch and 20 EMA
Real-Time Gains Tracker displaying Max Gains and open PnL
Past Performance labels displaying Max Gains and Max Drawdown for each trade
Higher Highs since BUY and Lower Lows since SELL
Once the external Signal is connected to the script, the results based on signal backtester ( TradeChartist PowerTracer Pro Backtester ) can be used to optimise the settings to generate plots and also to set Alerts for the following.
Long and Short Signals
Long and Short Stop Loss Hit
Long and Short TP Hit
Move up/down Trailing SL
To create alerts, the user must choose PowerTrader Pro from the alert condition drop-down and choose the required alert. Since the signals are generated only after confirmation, "Once per bar" must be used for Alerts.
===================================================================================================================
This is not a free to use indicator. Get in touch with me (PM me directly if you would like trial access to test the indicator)
Premium Scripts - Trial access and Information
Trial access offered on all Premium scripts.
PM me directly to request trial access to the scripts or for more information.
===================================================================================================================
Dual Purpose Pine Based CorrelationThis is my "Pine-based" correlation() function written in raw Pine Script. Other names applied to it are "Pearson Correlation", "Pearson's r", and one I can never remember being "Pearson Product-Moment Correlation Coefficient(PPMCC)". There is two basic ways to utilize this script. One is checking correlation with another asset such as the S&P 500 (provided as a default). The second is using it as a handy independent indicator correlated to time using Pine's bar_index variable. Also, this is in fact two separate correlation indicators with independent period adjustments, so I guess you could say this indicator has a dual purpose split personality. My intention was to take standard old correlation and apply a novel approach to it, and see what happens. Either way you use it, I hope you may find it most helpful enough to add to your daily TV tool belt.
You will notice I used the Pine built-in correlation() in combination with my custom function, so it shows they are precisely equal, even when the first two correlation() parameters are reversed on purpose or by accident. Additionally, there's an interesting technique to provide a visually appealing line with two overlapping plot()s combined together. I'm sure many members may find that plotting tactic useful when a bird's nest of plotting is occurring on the overlay pane in some scenarios. One more thing about correlation is it's always confined to +/-1.0 irregardless of time intervals or the asset(s) it is applied to, making it a unique oscillator.
As always, I have included advanced Pine programming techniques that conform to proper "Pine Etiquette". For those of you who are newcomers to Pine Script, this code release may also help you comprehend the "Power of Pine" by employing advanced programming techniques in Pine exhibiting code utilization in a most effective manner. One of the many tricks I applied here was providing floating point number safeties for _correlation(). While it cannot effectively use a floating point number, it won't error out in the event this should occur especially when applying "dominant cycle periods" to it, IF you might attempt this.
NOTICE: You may have observed there is a sqrt() custom function and you may be thinking... "Did he just sick and twistedly overwrite the Pine built-in sqrt() function?" The answer is... YES, I am and yes I did! One thing I noticed, is that it does provide slightly higher accuracy precision decimal places compared to the Pine built-in sqrt(). Be forewarned, "MY" sqrt() is technically speaking slower than snail snot compared to the native Pine sqrt(), so I wouldn't advise actually using it religiously in other scripts as a daily habit. It is seemingly doing quite well in combination with these simple calculations without being "sluggish". Lastly, of course you may always just delete the custom sqrt() function, via Pine Editor, and then the script will still operate flawlessly, yet more efficiently.
Features List Includes:
Dark Background - Easily disabled in indicator Settings->Style for "Light" charts or with Pine commenting
AND much, much more... You have the source!
The comments section below is solely just for commenting and other remarks, ideas, compliments, etc... regarding only this indicator, not others. When available time provides itself, I will consider your inquiries, thoughts, and concepts presented below in the comments section, should you have any questions or comments regarding this indicator. When my indicators achieve more prevalent use by TV members, I may implement more ideas when they present themselves as worthy additions. As always, "Like" it if you simply just like it with a proper thumbs up, and also return to my scripts list occasionally for additional postings. Have a profitable future everyone!

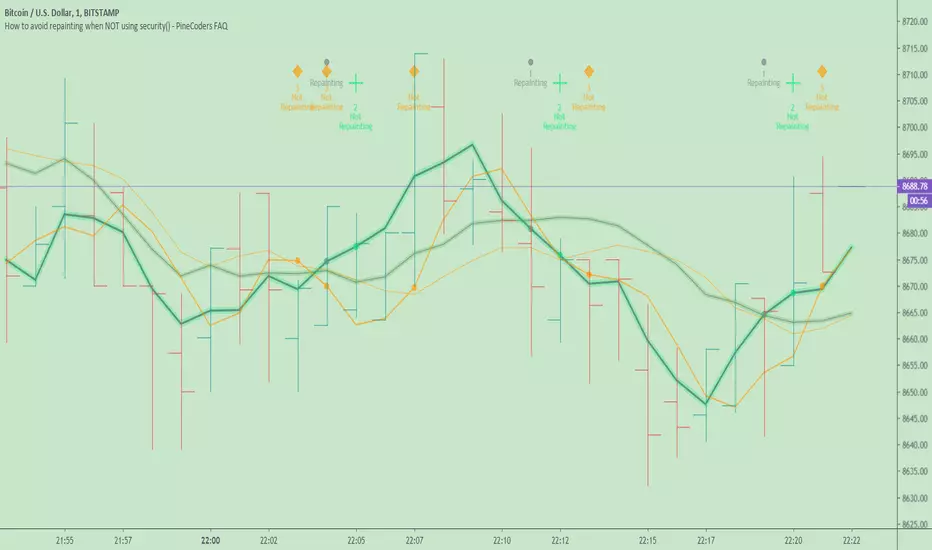
How to avoid repainting when NOT using security()Even when your code does not use security() calls, repainting dynamics still come into play in the realtime bar. Script coders and users must understand them and, if they choose to avoid repainting, need to know how to do so. This script demonstrates three methods to avoid repainting when NOT using the security() function.
Note that repainting dynamics when not using security() usually only come into play in the realtime bar, as historical data is fixed and thus cannot cause repainting, except in situations related to stock splits or dividend adjustments.
For those who don’t want to read
Configure your alerts to trigger “Once Per Bar Close” and you’re done.
For those who want to understand
Put this indicator on a 1 minute or seconds chart with a live symbol. As price changes you will see four of this script’s MAs (all except the two orange ones) move in the realtime bar. You are seeing repainting in action. When the current realtime bar closes and becomes a historical bar, the lines on the historical bars will no longer move, as the bar’s OHLC values are fixed. Note that you may need to refresh your chart to see the correct historical OHLC values, as exchange feeds sometimes produce very slight variations between the end values of the realtime bar and those of the same bar once it becomes a historical bar.
Some traders do not use signals generated by a script but simply want to avoid seeing the lines plotted by their scripts move during the realtime bar. They are concerned with repainting of the lines .
Other traders use their scripts to evaluate conditions, which they use to either plot markers on the chart, trigger alerts, or both. They may not care about the script’s plotted lines repainting, but do not want their markers to appear/disappear on the chart, nor their alerts to trigger for a condition that becomes true during the realtime bar but is no longer true once it closes. Those traders are more concerned with repainting of signals .
For each of the three methods shown in this script’s code, comments explain if its lines, markers and alerts will repaint or not. Through the Settings/Inputs you will be able to control plotting of lines and markers corresponding to each method, as well as experiment with the option, for method 2, of disabling only the lines plotting in the realtime bar while still allowing the markers and alerts to be generated.
An unavoidable fact is that non-repainting lines, markers or alerts are always late compared to repainting ones. The good news is that how late they are will in many cases be insignificant, so that the added reliability of the information they provide will largely offset the disadvantages of waiting.
Method 1 illustrates the usual way of going about things in a script. Its gray lines and markers will always repaint but repainting of the alerts the marker conditions generate can be avoided by configuring alerts to trigger “Once Per Bar Close”. Because this gray marker repaints, you will occasionally see it appear/disappear during the realtime bar when the gray MAs cross/un-cross.
Method 2 plots the same MAs as method 1, but in green. The difference is that it delays its marker condition by one bar to ensure it does not repaint. Its lines will normally repaint but its markers will not, as they pop up after the condition has been confirmed on the bar preceding the realtime bar. Its markers appear at the beginning of the realtime bar and will never disappear. When using this method alerts can be configured to trigger “Once Per Bar” so they fire the moment the marker appears on the chart at the beginning of the realtime bar. Note that the delay incurred between methods 1 and 2 is merely the instant between the close of a realtime bar and the beginning of the next one—a delay measured in milliseconds. Method 2 also allows its lines to be hidden in the realtime bar with the corresponding option in the script’s Settings/Inputs . This will be useful to those wishing to eliminate unreliable lines from the realtime bar. Commented lines in method 2 provide for a 2b option, which is to delay the calculation of the MAs rather than the cross condition. It has the obvious inconvenient of plotting delayed MAs, but may come in handy in some situations.
Method 3 is not the best solution when using MAs because it uses the open of bars rather than their close to calculate the MAs. While this provides a way of avoiding repainting, it is not ideal in the case of MA calcs but may come in handy in other cases. The orange lines and markers of method 3 will not repaint because the value of open cannot change in the realtime bar. Because its markers do not repaint, alerts may be configured using “Once Per Bar”.
Spend some time playing with the different options and looking at how this indicator’s lines plot and behave when you refresh you chart. We hope everything you need to understand and prevent repainting when not using security() is there.
Look first. Then leap.
Options Pivot Smile## Options Pivot Smile
**Options Pivot Smile** is a visual market-structure indicator that transforms classic daily pivot levels into a smooth, bell-shaped “smile curve.” It is designed to help traders understand price equilibrium, directional bias, and volatility expansion using historically anchored support and resistance zones.
The script is optimized for discretionary analysis, options structure mapping, and futures market context.
---
### Core Concept
This indicator calculates **previous-day Pivot, S1, S2, R1, and R2** levels and projects them backward across configurable historical widths. These anchor points are then connected using a **Catmull–Rom spline**, producing a smooth bell-shaped curve that represents market balance and skew.
The result is a **visual distribution of price pressure**, rather than static horizontal levels.
---
### Key Features
#### 1. Daily Pivot-Based Levels
* Uses **previous daily High, Low, Close**
* Calculates:
* Pivot (P)
* Support: S1, S2
* Resistance: R1, R2
* Optional **pivot shift** for futures or synthetic instruments
* Optional **spread rounding** for options strike alignment
---
#### 2. Historical Anchor Projection
Each level is placed at a different historical distance:
* **R2 / S2** → farthest back
* **R1 / S1** → medium range
* **Pivot** → nearest anchor
This spacing creates the structural foundation for the bell curve.
---
#### 3. Smile / Bell Curve Visualization
* Smooth curve generated using **Catmull–Rom spline interpolation**
* Adjustable smoothness (number of curve segments)
* Customizable color and line width
* Represents equilibrium, skew, and volatility structure
---
#### 4. Structural Aids
Optional visual components include:
* Horizontal projection lines to the current bar
* Dotted straight connecting lines between anchor points
* Anchor dots at each pivot level
* Adaptive-width level boxes scaled by ATR
---
#### 5. Professional Styling Controls
* Line style: Solid / Dotted / Dashed
* Adjustable strike line width
* Independent colors for:
* S2, S1
* Pivot
* R1, R2
* Box opacity, borders, and label text colors
---
### Use Cases
* Market balance and mean-reversion analysis
* Options strike clustering and distribution framing
* Futures pivot bias visualization
* Contextual support/resistance mapping
* Intraday and swing structure reference
---
### Notes & Limitations
* This is a **visual analytical tool**, not a trading strategy
* Does not generate buy/sell signals
* Best used in conjunction with price action, volume, or volatility tools
* Requires sufficient historical bars to render the full structure
---
### Recommended Timeframes
* Intraday (5m–30m) for structure context
* H1–H4 for swing equilibrium
* Works on all symbols with daily data availability
---
**Options Pivot Smile** converts traditional pivot math into an intuitive visual distribution, helping traders see market structure as a curve rather than isolated lines.

Morning ORB FVG Trigger✅ Overview
Morning ORB FVG Trigger is a complete intraday trading framework built around:
A Morning Opening Range Breakout (ORB)
The first Fair Value Gap (FVG) after that breakout
Strict risk management and position sizing
Optional HTF trend filter (Daily / Weekly / Monthly)
Optional Daily ATR filter to avoid extreme days
The script is designed for futures / indices / FX on intraday charts up to 15 minutes and for traders who want a clean, mechanical entry framework with clear risk.
🧠 Core idea
Define a morning opening range (e.g. 09:30–09:45).
Wait for a clean breakout above/below that range.
After the breakout, wait for the first FVG in breakout direction,
confirmed by the next candle (no immediate full reclaim).
Use a chosen stop logic + R:R factor to build risk/reward boxes.
Calculate position size based on your account risk.
(Optional) Only take trades:
In the direction of the HTF EMA trend (D/W/M).
On days where the morning range is within a band of the Daily ATR.
You can also disable all signals/boxes and use the script just as a visual ORB tool.
⏰ 1. ORB / Morning Range
Inputs (Main section)
Morning Range Session
Time window of the opening range in exchange time
Example: 09:30–09:45 for a 15-minute ORB.
You can type custom ranges (e.g. 09:30–09:35 for a 5-minute ORB).
Risk/Reward (TP factor)
Multiplier for the take-profit distance relative to the stop.
2.0 = TP is 2× the stop distance
1.5 = TP is 1.5× the stop distance
Show ORB range
If enabled, draws:
ORB high/low lines
ORB labels (e.g. 15min ORB high / low)
Optional midline
Extend ORB lines to the right (bars)
How many bars to extend the ORB high/low horizontally beyond the ORB itself.
Trade box width (bars)
Horizontal width (in bars) of:
Red risk box (entry–stop)
Green reward box (entry–TP)
Implementation details
The ORB is always calculated on 1-minute data internally, so it stays precise even on 5m/15m charts.
The script only works on intraday timeframes up to 15 minutes.
📦 2. FVG Block
Group: “FVG”
Threshold %
Minimum size of an FVG in % of price.
0 = every FVG
Higher values = only larger gaps
Auto threshold (from volatility)
If enabled, the minimum FVG size is derived from historical volatility
instead of a fixed percentage.
Allow breakout FVG partly inside ORB
Off (default): the FVG must lie fully outside the ORB.
On: the breakout FVG itself may still overlap the ORB a bit,
as long as it is the first one attached to the breakout move.
Enable FVG entry signals, boxes & alerts
On: full system – FVG detection, entry labels, risk/TP boxes, alerts.
Off: no entries, no risk/TP boxes, no alerts.
You only get the ORB and (optionally) the HTF dashboard, so you can trade your own setups.
Entry mode
Entry mode (Mid / Edge / NextOpen)
Mid – Entry at the midpoint of the FVG.
Edge – Long at the upper FVG edge, short at the lower FVG edge.
NextOpen – No limit order in the gap. Entry is placed at the next bar open after FVG confirmation.
Edge offset (ticks)
Additional offset for Edge entries:
Long:
+ticks = a bit above the FVG (more conservative)
-ticks = deeper into the FVG (more aggressive)
Short:
+ticks = a bit below the FVG
-ticks = deeper into the FVG
FVG detection logic
Uses a LuxAlgo-style 3-candle FVG pattern (gap between candle 1 and 3).
Only one FVG is taken: the first valid FVG after the ORB breakout in breakup direction.
The FVG candle is the middle bar; the script:
Detects the FVG on the previous bar.
Waits for the current bar to confirm it:
Bullish: current low must stay above the lower FVG boundary
Bearish: current high must stay below the upper FVG boundary
Only then an entry signal is generated.
🛑 3. Stop Logic
Group: “Stop Logic”
Stop mode (PrevBar / Pivot / FVG Candle)
PrevBar – Stop at the low/high of the candle before the FVG
(tight/aggressive).
FVG Candle – Stop at the low/high of the FVG candle itself
(medium).
Pivot – Stop at the most recent swing high/low
using pivotLeft / pivotRight pivots (more conservative).
Ticks (stop buffer)
Offset (in ticks) from the selected stop level.
> 0 = further away (more room, more risk)
< 0 = closer (tighter stop)
Pivot left / Pivot right
Number of candles left/right to define a swing high/low
when using Pivot stop mode.
Typical intraday values: 2–3.
The script also sanity-checks the stop:
if the calculated stop would be invalid (e.g. above entry in a long), it moves it by a minimal distance (2 ticks) to keep a valid risk.
📈 4. HTF Trend Filter (Daily / Weekly / Monthly)
Group: “HTF Trend Filter”
Enable HTF trend filter
If enabled, trades are only allowed:
Long when at least 2 of D/W/M closes are above their EMA
Short when at least 2 of D/W/M closes are below their EMA
EMA length (D/W/M)
EMA length for all three higher timeframes (Daily, Weekly, Monthly).
This helps focus entries in the direction of the dominant higher-timeframe trend.
📊 5. ATR Filter (Daily)
Group: “ATR Filter (Daily)”
Use daily ATR filter
If enabled, the height of the ORB (ORB high – ORB low) must be within
a band of the Daily ATR to allow any signals.
Daily ATR length
ATR period on the Daily timeframe.
Min ORB size vs ATR
Lower bound:
Example: 0.3 → ORB must be at least 0.3 × Daily ATR
0.0 = no minimum.
Max ORB size vs ATR
Upper bound:
Example: 1.5 → ORB must be ≤ 1.5 × Daily ATR
0.0 = no maximum.
If the ORB is too small (choppy) or too large (exhausted move), no breakout or FVG signal will be generated on that day.
🧭 6. HTF Dashboard & Signal Labels
Group: “HTF Trend Dashboard”
Show HTF dashboard
Draws a small label at the top of the chart showing:
HTF Trend (EMA X)
D: UP/FLAT/DOWN
W: UP/FLAT/DOWN
M: UP/FLAT/DOWN
Dashboard position
Top Right, Top Center, Top Left – places the dashboard at the top.
Over Risk Info – no top dashboard; instead, the HTF trend info is shown as a label near the risk box when a new signal appears.
Lookback (bars) for top anchor
How many bars to use to determine the top price level for dashboard placement.
Show HTF trend above risk box on signal
Only relevant if Dashboard position = Over Risk Info.
When enabled, a small HTF label appears near the risk box for each new trade.
Signal label vertical offset (ticks)
Vertical spacing between risk info label and HTF label.
Minimum spacing HTF/Risk (ticks)
Ensures a minimum vertical distance so the two labels don’t overlap.
HTF signal label X offset (bars)
Horizontal offset (left/right) relative to the risk info label.
⏳ 7. ORB–FVG Filters (Session & Time Window)
Group: “ORB FVG Filter”
Only same session day
If enabled, FVG entries are only allowed on the same calendar day
as the ORB. When the date changes, all state & drawings are reset.
Limit hours after ORB
Enables a time window after the ORB end.
Trading window after ORB (hours)
Length of that window in hours.
Example: 2.0 → FVG signals only in the first 2 hours after ORB end.
💰 8. Risk Management & Position Sizing
Group: “Risk Management”
Calculate position size
If enabled, the script computes suggested mini and micro contract size for you.
Account size
Your trading account size (in account currency).
Risk mode
Percent – risk is a % of account size (Account risk %).
Fixed amount – risk is a fixed dollar amount (Fixed risk ($)).
Account risk %
Risk per trade as a percentage of account size (e.g. 1.0 for 1%).
Fixed risk ($)
Fixed risk per trade in dollars when using Fixed amount mode.
Micro factor (vs mini)
How much a micro contract is worth relative to a mini.
Example:
0.1 → one micro moves 1/10 of one mini.
Risk Info label
For each new trade, a label is shown above the boxes with:
Stop distance in price and $ risk per mini
Max risk allowed for the trade
Suggested mini and micro size
Text like:
Suggested: 2 mini
Suggested: 5 micro
or Suggested: no trade
This makes the script especially useful for prop-firm rules or strict risk discipline.
🎨 9. Visual Style (Boxes, Labels, ORB Lines)
Group: “Box & Label Style (Trade)”
Label font size (Very small, Small, Normal, Large)
Entry label BG / text color
Stop label BG / text color
TP label BG / text color
Risk info BG / text color
Risk box color (entry–stop zone)
Reward box color (entry–TP zone)
Group: “ORB Style”
ORB high line color
ORB low line color
ORB line width
ORB label font size
ORB label background color
ORB label text color
Show ORB midline
ORB midline color / width / style (Solid / Dashed / Dotted)
⚠️ 10. Alerts
Group: “Alerts”
The script defines three alert conditions:
Long entry FVG breakout
Triggered when a new long signal appears.
Short entry FVG breakout
Triggered when a new short signal appears.
FVG entry (long/short)
Generic alert for any new signal (long or short).
To use them:
Add the indicator to the chart.
Open the Alerts dialog → “Condition”.
Select this script and one of the alert conditions.
Set your preferred expiration and notification settings.
Alerts only fire when Enable FVG entry signals, boxes & alerts is on.
🧩 11. How the trading logic flows (summary)
Build ORB on 1-minute data during the selected session.
Optionally reject the day if ORB is outside the ATR bounds.
Wait for a breakout (close above high or below low), respecting HTF trend filter.
After breakout, look for the first valid FVG in that direction:
Outside the ORB (unless breakout FVG allowed inside)
Confirmed by the next candle (no full reclaim)
Once confirmed:
Compute entry, stop, target.
Draw risk/reward boxes and all labels.
Optionally show HTF signal label over the risk info.
Trigger alerts if enabled.
If you disable FVG signals, only steps 1–3 (plus dashboard) are effectively active.
⚠️ 12. Notes & Disclaimer
Script is intended for intraday trading up to 15-minute timeframes.
All signals are mechanical and do not guarantee profitability.
Always backtest and forward-test on your own data before risking real money.
This script is for educational purposes only and is not financial advice.
🚀 Quick-start guide
Add the script to your chart
Use an intraday timeframe ≤ 15 minutes (1m, 3m, 5m, 15m).
Works best on liquid indices, futures, FX and large-cap stocks.
Set the Morning Range
In “Morning Range Session” choose the exchange’s opening window.
Examples
US index futures (CME): 08:30–08:45 or 08:30–08:35
US stocks (NYSE/Nasdaq): 09:30–09:45 or 09:30–09:35
The ORB is always calculated on 1-minute data internally, so the range stays accurate on higher intraday charts.
Keep the default filters at first
HTF Trend Filter: ON
EMA length = 20
This will only allow trades in the direction of the dominant D/W/M trend.
ATR Filter: OFF (optional; you can enable later once you’re comfortable).
Use the full trade system
In the FVG group leave
“Enable FVG entry signals, boxes & alerts” = ON
Entry mode: Mid
Stop mode: FVG Candle or PrevBar
Risk/Reward: 2.0 as a starting point.
Set your risk
Turn on “Calculate position size”.
Enter your Account size and choose either:
Risk mode = Percent (e.g. 1.0 = 1% per trade), or
Risk mode = Fixed amount (e.g. $250 per trade).
The risk info label will show:
Stop distance in price and $/contract
Max allowed risk
Suggested mini and micro contract size.
Enable alerts (optional)
Open the Alerts dialog → Condition: this script.
Choose one of:
Long entry FVG breakout
Short entry FVG breakout
FVG entry (long/short)
Choose “Once per bar” or “Once per bar close”, and your preferred notification type.
Replay & journal
Use the TradingView bar replay tool to step through past days.
Focus on:
How the ORB defines the structure.
How the first confirmed FVG outside the ORB behaves.
Whether the risk/TP levels fit your own style and product.
🎛 Recommended settings & profiles
These are starting points, not rules. Always adapt to the instrument and your own risk tolerance.
1. Conservative / Trend-following
Timeframe: 5m or 15m
Morning Range Session: 15-minute ORB around the cash or futures open
FVG
Threshold %: 0.05–0.1 (filter out very small gaps)
Auto threshold: OFF (keep it simple)
Allow breakout FVG partly inside ORB: OFF
Enable FVG entry signals/boxes/alerts: ON
Entry mode: Mid
Stop Logic
Stop mode: Pivot
Pivot left/right: 2–3
Stop buffer: +1–2 ticks
HTF Trend Filter
Enabled: ON
EMA length: 20
ATR Filter
Enabled: ON
Daily ATR length: 14
Min ORB vs ATR: 0.3–0.4
Max ORB vs ATR: 1.2–1.5
Risk Management
Risk mode: Percent
Account risk: 0.5–1.0%
Idea: Only trade when the higher-timeframe trend supports the move and the opening range is of a “normal” size for the current volatility.
2. Balanced / Intraday directional
Timeframe: 3m or 5m
FVG
Threshold %: 0.02–0.05
Auto threshold: ON (lets the script adapt to volatility)
Allow breakout FVG partly inside ORB: ON
(first breakout FVG may partly sit inside the ORB)
Entry mode: Edge
Edge offset (ticks): 0 or +1
Stop Logic
Stop mode: FVG Candle
Stop buffer: 0–1 ticks
HTF Trend Filter
Enabled: ON
ATR Filter
Enabled: OFF (optional)
Risk Management
Risk mode: Percent
Account risk: 1.0–1.5% (if this fits your plan)
Idea: Slightly more aggressive entries at the gap edge, still aligned with HTF trend, but with more flexibility on ATR.
3. Aggressive / Scalping around the ORB
Timeframe: 1m or 3m
FVG
Threshold %: 0.0–0.02
Auto threshold: ON
Allow breakout FVG partly inside ORB: ON
Entry mode: NextOpen or Edge with a negative offset (deeper into the gap)
Stop Logic
Stop mode: PrevBar
Stop buffer: 0 or -1 tick
HTF Trend Filter
Enabled: OFF (or ON but treat as soft guidance)
ATR Filter
Enabled: OFF
Risk Management
Risk mode: Percent
Account risk: lower, e.g. 0.25–0.5% per trade
Idea: More trades and tighter stops. Best for experienced traders who understand the limitations of scalping and whipsaw risk.
Final reminder
All of these are templates, not guarantees:
Always check how the system behaves on your market and session.
Start on replay and demo before trading real money.
Adjust filters (HTF, ATR, thresholds) until the signals fit your personal approach.

Momentum Master v1# Momentum Master v1 - Multi-Strategy Trading System
## SCRIPT OVERVIEW
Momentum Master v1 is a multi-strategy trading system that integrates 6 distinct trading methodologies (EMA Crossover, RSI Mean Reversion, Breakout, MACD Crossover, Bollinger Bands, Volume Breakout) through a shared risk management pipeline. This script implements a proprietary integration framework that creates synergistic value beyond what individual indicators provide, combining advanced technical analysis techniques with institutional flow analysis.
## TECHNICAL METHODOLOGY
### Multi-Strategy Signal Generation Framework
The script operates on a shared execution framework where all six trading strategies share the same risk management system, but each strategy uses its own unique entry logic:
1. **EMA Crossover System**: Detects momentum shifts using configurable fast/slow EMA periods (Standard 9/21, Fast 7/17, Slow 13/26, or Custom)
2. **RSI Mean Reversion**: Identifies overbought/oversold conditions for counter-trend opportunities
3. **Breakout Detection**: Captures price breakouts from consolidation zones
4. **MACD Crossover**: Uses MACD line crossovers to confirm trend changes
5. **Bollinger Bands**: Trades bounces from band extremes and breakouts
6. **Volume Breakout**: Confirms moves with above-average volume
**Why This Integration Creates Unique Value:**
This is not a simple indicator mashup. The proprietary integration framework creates synergistic value through:
- **Shared Risk Management**: All strategies share ATR-based stop loss calculation and multiple take profit levels (TP1-TP6 with ratios 1:2, 1:4, 1:6, 1:8, 1:10, 1:12)
- **Adaptive Confidence Scoring**: The system evaluates market context from multiple perspectives simultaneously
- **Shared Filter System**: Optional filters (RSI extremes, ADX trend strength, Volume confirmation, POC proximity) apply uniformly across all strategies
## FLOW ANALYSIS INTEGRATION
### Fair Value Gap (FVG) Retracement Validation
The script implements proprietary FVG detection with retracement validation logic:
- **200-bar lookback** with **20% ATR tolerance** for gap identification
- **Retracement confirmation**: Signals can require price to retrace into a recent FVG before entry (optional filter)
- **Size filtering**: Only displays FVGs above minimum ATR threshold (configurable)
- **Visual tracking**: Shows last N FVGs with color-coded boxes (bullish green, bearish red)
**How FVG Integration Enhances Strategy Signals:**
When a strategy generates a signal, the FVG system validates whether price has recently retraced into an institutional order flow gap. This adds a layer of confirmation that the move is supported by institutional activity, not just retail momentum.
### Order Block Detection with Directional Alignment
- **Institutional accumulation/distribution zones**: Identifies the last bullish/bearish candle before a significant move
- **Directional filter**: Optional setting to only allow trades aligned with the most recent order block direction
- **ATR-based size filtering**: Filters out noise by requiring minimum order block size
- **Visual display**: Shows order blocks as colored boxes extending N bars forward
**Integration Logic:**
Order blocks represent areas where institutions accumulated or distributed positions. When a strategy signal occurs near an order block, it indicates higher probability that the move will continue in the block's direction.
### Multi-Timeframe POC (Point of Control) Analysis
The script calculates and displays POC levels from multiple timeframes:
- **Volume Profile POC**: Highest volume price over last N bars (configurable lookback)
- **Session POC**: Point of control for current trading session
- **Daily POC**: Daily volume-weighted average price
- **Weekly POC**: Weekly volume-weighted average price (optional)
**POC Proximity Filtering:**
Optional filters allow signals only when price is within X ATR of a POC level. This ensures entries occur at statistically significant price levels where liquidity is concentrated.
## FIBONACCI EXTENSION SYSTEM
### Dynamic Fibonacci Calculation
- **Swing-based detection**: Automatically identifies swing highs and lows using configurable lookback period
- **Extension levels**: Calculates Fibonacci extension levels (0.618, 0.786, 1.0, 1.272, 1.414, 1.618, 2.0, 2.618)
- **Retracement levels**: Shows standard retracement levels (0.236, 0.382, 0.5, 0.618, 0.786)
- **Negative levels**: Optional negative Fibonacci levels (-0.27, -0.618) for extended targets
**How Fibonacci Enhances Risk Management:**
Take profit levels are automatically calculated using Fibonacci extension mathematics. The system identifies the swing structure and projects potential reversal zones, allowing traders to set targets based on mathematical probability rather than arbitrary price levels.
## LIQUIDITY ZONE DETECTION
### Buy and Sell Side Liquidity
- **Swing-based liquidity zones**: Identifies recent swing highs (sell-side liquidity) and swing lows (buy-side liquidity)
- **Configurable lookback**: Adjustable period for liquidity zone detection
- **Visual display**: Horizontal lines extending N bars forward to show liquidity targets
- **Maximum zones**: Limits display to most recent N zones to avoid chart clutter
**Trading Application:**
Liquidity zones represent areas where stop losses are likely clustered. Price often moves to "sweep" these liquidity zones before reversing, creating high-probability entry opportunities.
## RISK MANAGEMENT SYSTEM
### ATR-Based Stop Loss Calculation
- **Dynamic stop placement**: Stop loss calculated using ATR (Average True Range) with configurable multiplier
- **Adaptive to volatility**: Stop loss automatically adjusts to current market volatility conditions
- **Configurable ATR period**: Default 14-period ATR, adjustable from 5-30 periods
- **SL multiplier**: Adjustable from 0.5x to 10x ATR for different risk profiles
### Multiple Take Profit Levels
The system supports up to 6 take profit levels with fixed risk-reward ratios:
- **TP1**: 1:2 risk-reward ratio
- **TP2**: 1:4 risk-reward ratio
- **TP3**: 1:6 risk-reward ratio
- **TP4**: 1:8 risk-reward ratio (optional)
- **TP5**: 1:10 risk-reward ratio (optional)
- **TP6**: 1:12 risk-reward ratio (optional)
**Why Multiple TP Levels:**
This allows partial profit-taking at key Fibonacci extension levels while letting winners run. The system tracks win rates for each TP level, helping traders optimize their exit strategy.
## SIGNAL FILTERS (OPTIONAL ENHANCEMENTS)
### RSI Extreme Filter
- **Avoid overbought/oversold extremes**: Prevents entries when RSI is in extreme zones (default: >70 overbought, <30 oversold)
- **Configurable thresholds**: Adjustable RSI levels and calculation period
- **Purpose**: Reduces false signals in exhausted moves
### ADX Trend Strength Filter
- **Avoid choppy markets**: Only allows trades when ADX indicates trending conditions (default: ADX > 20)
- **Configurable threshold**: Adjustable ADX minimum value (10-50)
- **Purpose**: Filters out low-probability trades in ranging markets
### Volume Confirmation
- **Volume multiplier**: Requires volume above X times average (default: 1.1x)
- **Purpose**: Ensures moves are supported by institutional participation
### POC Proximity Filters
- **Volume POC filter**: Only enter when price is near Volume Profile POC
- **Session POC filter**: Only enter when price is near Session POC
- **Daily POC filter**: Only enter when price is near Daily POC
- **Weekly POC filter**: Only enter when price is near Weekly POC
- **Proximity threshold**: Configurable ATR multiplier for "near" definition (default: 2.0x ATR)
---
## DIVERGENCE DETECTION
### MFI (Money Flow Index) Divergence
- **Bullish divergence**: Price makes lower low, MFI makes higher low (potential reversal up)
- **Bearish divergence**: Price makes higher high, MFI makes lower high (potential reversal down)
- **Configurable lookback**: Adjustable period for divergence detection (default: 100 bars)
- **Minimum bars between divergences**: Prevents duplicate signals (default: 10 bars)
- **Advanced thresholds**: Separate thresholds for RSI, price, and MFI divergence strength
**Note**: Divergence detection is visual-only and does not filter trades. It provides additional market context for discretionary traders.
## MARKET CONTEXT TOOLS
### Session High/Low Lines
- **Recent session extremes**: Displays horizontal lines for session high and low
- **Configurable lookback**: Adjustable period for session calculation (default: 10 bars)
- **Purpose**: Identifies key intraday support/resistance levels
### Swing Point Detection
- **Automatic swing identification**: Marks significant swing highs and lows
- **Visual reference**: Helps identify market structure and trend direction
### Signal Overview Table
Real-time technical analysis overview:
- **Current RSI**: Relative Strength Index value
- **ATR**: Current Average True Range
- **ADX**: Average Directional Index (trend strength)
- **EMA status**: Current fast/slow EMA relationship (Bullish/Bearish/Neutral)
- **POC levels**: Current price relative to POC levels
- **Confidence score**: Calculated confidence percentage based on confluence
- **Volume trend**: Current volume trend direction
## CHART DISPLAY OPTIONS
### Entry/SL/TP Lines
- **Visual trade management**: Displays entry price, stop loss, and all take profit levels as horizontal lines
- **Configurable length**: Lines extend N bars forward (default: 30 bars)
- **Color-coded**: Different colors for entry, stop loss, and each TP level
### Win/Loss Labels
- **Trade verification**: Displays up to 500 individual win/loss labels on chart
- **Visual feedback**: Green labels for wins, red labels for losses
- **Performance tracking**: Helps verify strategy performance visually
## USAGE INSTRUCTIONS
### Initial Setup
1. **Select Strategy Mode**: Choose your preferred trading strategy from the dropdown (EMA Crossover, RSI Mean Reversion, Breakout, MACD Crossover, Bollinger Bands, Volume Breakout, or Disabled)
2. **Configure Risk Management**:
- Set ATR Length for stop loss calculation (default: 14)
- Set SL ATR Multiplier (default: 1.0)
- Enable additional TP levels if desired (TP4-TP6 are optional)
3. **Adjust Strategy Parameters**: Each strategy has its own settings group. Configure EMA periods, RSI settings, MACD parameters, etc., based on your selected strategy.
### Recommended Settings by Market Type
**Forex/Crypto (High Volatility)**:
- EMA Mode: Fast (7/17) or Custom (3/21)
- SL ATR Multiplier: 1.5-2.0
- Enable FVG retracement filter
- Enable Order Block directional filter
**Stocks (Moderate Volatility)**:
- EMA Mode: Standard (9/21)
- SL ATR Multiplier: 1.0-1.5
- Enable ADX filter to avoid choppy markets
- Enable Volume confirmation
**Indices (Lower Volatility)**:
- EMA Mode: Slow (13/26)
- SL ATR Multiplier: 0.8-1.2
- Enable POC proximity filters
- Enable RSI extreme filter
### Advanced Configuration
1. **Enable Optional Filters**: Navigate to "Signal Filters" section and enable filters that match your trading style
2. **Configure Market Analysis Tools**: Adjust FVG, Order Block, Fibonacci, and POC settings in their respective sections
3. **Customize Display**: Toggle chart display options to show/hide various elements based on your preference
---
## WHY THIS INDICATOR COMBINATION CREATES UNIQUE VALUE
### Multi-Layered Confluence Analysis
This script is not a simple indicator mashup. It implements a proprietary integration framework that creates synergistic value through three layers of analysis:
**Layer 1: Fibonacci Mathematics**
- Golden Zone identification (61.8%-78.6% retracement zone) using three-point trend-based calculation
- Extension targets based on swing structure mathematics
- Statistically significant retracement areas where price is likely to reverse
**Layer 2: Institutional Flow Analysis**
- Fair Value Gaps (FVGs) identify order flow gaps where price must return
- Order Blocks mark institutional accumulation/distribution zones
- Multi-timeframe POC analysis shows where liquidity is concentrated
- Liquidity zones identify where stop losses cluster
**Layer 3: Multi-Strategy Signal Generation**
- Six different entry methodologies provide multiple perspectives
- Shared risk management ensures consistent position sizing
- Adaptive confidence scoring evaluates confluence from all three layers
- Optional filters allow customization for different market conditions
### Proprietary Integration Framework
The unique value comes from how these components work together:
1. **Strategy generates signal** → 2. **FVG/Order Block validates institutional support** → 3. **POC confirms liquidity level** → 4. **Fibonacci provides target zones** → 5. **Risk management calculates optimal SL/TP placement**
This creates a complete trading system, not just a collection of indicators.
---
## TECHNICAL SPECIFICATIONS
- **Pine Script Version**: v6
- **Chart Type**: Overlay (displays on price chart)
- **Max Bars Back**: 5000 (for historical analysis)
- **Max Labels**: 500 (for win/loss tracking)
- **Compatibility**: Works on all timeframes and instruments
- **Performance**: Optimized for real-time execution
---
## DISCLAIMER
This script is a technical analysis tool and does not constitute financial, investment, trading, or other types of advice. Past performance does not guarantee future results. Always use proper risk management and never risk more than you can afford to lose. The script's signals are based on mathematical calculations and should be used in conjunction with your own analysis and risk management practices.
---
## SUPPORT AND ACCESS
This is an invite-only script. To request access:
1. Visit: www.pinescriptedge.com
2. Include your TradingView username and brief trading experience
3. Access will be reviewed and granted within 24 hours
**Note**: TradingView does NOT recommend paying for or using a script unless you fully trust its author and understand how it works. You may also find free, open-source alternatives in our community scripts.
---
## VERSION INFORMATION
**Momentum Master v1** - Initial release with multi-strategy framework and institutional flow analysis integration.
For updates and new features, follow the script or check the author's profile for version announcements.

Range Bar Gaps DetectorRange Bar Gaps Detector
Overview
The Range Bar Gaps Detector identifies price gaps across multiple range bar sizes (12, 24, 60, and 120) on any trading instrument, helping traders spot potential support/resistance zones or breakout opportunities. Designed for Pine Script v6, this indicator detects gaps on range bars and exports data for use in companion scripts like Range Bar Gaps Overlap, making it ideal for multi-timeframe gap analysis.
Key Features
Multi-Range Gap Detection: Identifies gaps on 12, 24, 60, and 120-range bars, capturing both bullish (gap up) and bearish (gap down) price movements.
Customizable Sensitivity: Includes a user-defined minimum deviation (default: 10% of 14-period SMA) for 12-range gaps to filter out noise.
7-Day Lookback: Automatically prunes gaps older than 7 days to focus on recent, relevant price levels.
Data Export: Serializes up to 10 gaps per range (tops, bottoms, start bars, highest/lowest prices, and age) for seamless integration with overlap analysis scripts.
Debugging Support: Plots gap counts and aggregation data in the Data Window for easy verification of detected gaps.
How It Works
The indicator aggregates price movements to simulate higher range bars (24, 60, 120) from a base range bar chart. It detects gaps when the price jumps significantly between bars, ensuring gaps meet the minimum deviation threshold for 12-range bars. Gaps are stored in arrays, serialized for external use, and pruned after 7 days to maintain efficiency.
Usage
Add to your range bar chart (e.g., 12-range) to detect gaps across multiple ranges.
Use alongside the Range Bar Gaps Overlap indicator to visualize gaps and their overlaps as boxes on the chart.
Check the Data Window to confirm gap counts and sizes for each range (12, 24, 60, 120).
Adjust the "Minimal Deviation (%) for 12-Range" input to control gap detection sensitivity.
Settings
Minimal Deviation (%) for 12-Range: Set the minimum gap size for 12-range bars (default: 10% of 14-period SMA).
Range Sizes: Fixed at 24, 60, and 120 for higher range bar aggregation.
Notes
Ensure the script is published under your TradingView username (e.g., GreenArrow2005) for use with companion scripts.
Best used on range bar charts to maintain consistent gap detection.
For advanced overlap analysis, pair with the Range Bar Gaps Overlap indicator to highlight zones where gaps from different ranges align.
Ideal For
Traders seeking to identify key price levels for support/resistance or breakout strategies.
Multi-timeframe analysts combining gap data across various range bar sizes.
Developers building custom indicators that leverage gap data for advanced charting.

Futures Risk CalculatorFutures Risk Calculator Script - Description
The Futures Risk Calculator (FRC) is a comprehensive tool designed to help traders effectively manage risk when trading futures contracts. This script allows users to calculate risk/reward ratios directly on the chart by specifying their entry price and stop loss. It's an ideal tool for futures traders who want to quantify their potential losses and gains with precision, based on their trading account size and the number of contracts they trade.
What the Script Does:
1. Risk and Reward Calculation:
The script calculates your total risk in dollars and as a percentage of your account size based on the entry and stop-loss prices you input.
It also calculates two key levels where potential reward (Take Profit 1 and Take Profit 2) can be expected, helping you assess the reward-to-risk ratio for any trade.
2. Customizable Settings:
You can specify the size of your trading account (available $ for Futures trading) and the number of futures contracts you're trading. This allows for tailored risk management that reflects your exact trading conditions.
3. Live Chart Integration:
You add the script to your chart after opening a futures chart in TradingView. Simply click on the chart to set your Entry Price and Stop Loss. The script will instantly calculate and display the risk and reward levels based on the points you set.
Adjusting the entry and stop-loss points later is just as easy: drag and drop the levels directly on the chart, and the risk and reward calculations update automatically.
4. Futures Contract Support:
The script is pre-configured with a list of popular futures symbols (like ES, NQ, CL, GC, and more). If your preferred futures contract isn’t in the list, you can easily add it by modifying the script.
The script uses each symbol’s point value to ensure precise risk calculations, providing you with an accurate dollar risk and potential reward based on the specific contract you're trading.
How to Use the Script:
1. Apply the Script to a Futures Chart:
Open a futures contract chart in TradingView.
Add the Futures Risk Calculator (FRC) script as an indicator.
2. Set Entry and Stop Loss:
Upon applying the script, it will prompt you to select your entry price by clicking the chart where you plan to enter the market.
Next, click on the chart to set your stop-loss level.
The script will then calculate your total risk in dollars and as a percentage of your account size.
3. View Risk, Reward, and (Take Profit):
You can immediately see visual lines representing your entry, stop loss, and the calculated reward-to-risk ratio levels (Take Profit 1 and Take Profit 2).
If you want to adjust the entry or stop loss after plotting them, simply move the points on
the chart, and the script will recalculate everything for you.
4. Configure Account and Contracts:
In the script settings, you can enter your account size and adjust the number of contracts you are trading. These inputs allow the script to calculate risk in monetary terms and as a percentage, making it easier to manage your risk effectively.
5. Understand the Information in the Table:
Once you apply the script, a table will appear in the top-right corner of your chart, providing you with key information about your futures contract and the trade setup. Here's what each field represents:
Account Size: Displays your total account value, which you can set in the script's settings.
Future: Shows the selected futures symbol, along with key details such as its tick size and point value. This gives you a clear understanding of how much one point or tick is worth in dollar terms.
Entry Price: The exact price at which you plan to enter the trade, displayed in green.
Stop Loss Price: The price level where you plan to exit the trade if the market moves against you, shown in red.
Contracts: The number of futures contracts you are trading, which you can adjust in the settings.
Risk: Highlighted in orange, this field shows your total risk in dollars, as well as the percentage risk based on your account size. This is a crucial value to help you stay within your risk tolerance and manage your trades effectively.

ICT Immediate Rebalance [LuxAlgo]The ICT Immediate Rebalance aims at detecting and highlighting immediate rebalances, a concept taught by Inner Circle Trader. The ICT Immediate Rebalance, although frequently overlooked, emerges as one of ICT's most influential concepts, particularly when considered within a specific context.
🔶 USAGE
Immediate rebalances, a concept taught by ICT, hold significant importance in decision-making. To comprehend the concept of immediate rebalance, it's essential to grasp the notion of the fair value gap. A fair value gap arises from market inefficiencies or imbalances, whereas an immediate rebalance leaves no gap, no inefficiencies, or no imbalances that the price would need to return to.
Following an immediate rebalance, the typical expectation is for two extension candles to ensue; failing this, the immediate rebalance is deemed unsuccessful. It's important to note that both failed and successful immediate rebalances hold significance in trading when analyzed within a contextual framework.
Immediate rebalances can manifest across various locations and timeframes. It's recommended to analyze them in conjunction with other ICT tools or technical indicators to gain a more comprehensive understanding of market dynamics.
🔹 Multi Timeframe
The script facilitates multi-timeframe analysis, enabling users to display immediate rebalances from higher timeframes.
Enabling the display of higher timeframe candles helps visualize the detected immediate rebalance patterns.
🔹 Dashboard
The dashboard offers statistical insights into immediate rebalances.
🔶 SETTINGS
🔹 Immediate Rebalances
Timeframe: this option is to identify immediate rebalances from higher timeframes. If a timeframe lower than the chart's timeframe is selected, calculations will be based on the chart's timeframe.
Bullish, and Bearish Immediate Rebalances: color customization options.
Wicks 75%, %50, and %25: color customization options of the wick price levels for the detected immediate rebalances.
Immediate Rebalance Candles: toggles the visualization of higher timeframe candles where immediate rebalance is detected.
Confirmation (Bars): specifies the number of bars required to confirm the validation of the detected immediate rebalance.
Immediate Rebalance Icon: allows customization of the size of the icon used to represent the immediate rebalance.
🔹 Dashboard
Dashboard: toggles the visualization of the dashboard, sets its location, and customizes the size of the dashboard.
🔶 RELATED SCRIPTS
Fair-Value-Gap
Thanks to our community for recommending this script. For more conceptual scripts and related content, we welcome you to explore by visiting >>> LuxAlgo-Scripts .

Wiseball RSI Super Advanced Divergences | EssentialThis indicator is a cutting-edge tool designed to elevate your trading strategy by identifying both regular and hidden RSI divergences with unparalleled precision. Moreover, this indicator uniquely offers the capability to visualize divergences as they are forming ("anticipated"), a feature that stands out for its originality and innovation.
Unique Features and How They Work:
This tool distinguishes itself by leveraging its Divergences Detection System (DDS), which incorporates advanced algorithms to analyze market movements and oscillator behavior beyond the capabilities of existing open-source scripts. Here's a brief overview of what makes DDS uniquely effective:
Anticipated and Projected Divergences: DDS goes beyond mere detection of existing divergences. It offers insights into divergences that are currently forming and even projects potential future divergences by analyzing current trends and oscillator levels. This forward-looking feature empowers traders to anticipate market movements, offering a strategic advantage.
Comprehensive Pivot Analysis: Unlike typical divergence indicators, such as the "RSI Divergence Indicator," which only identifies divergences between two consecutive pivots, DDS is engineered to analyze as many previous pivots as the user's configuration allows (duration min/max). This capability ensures that no potential trend or extended divergence is overlooked, providing a more thorough market analysis.
Multiple Divergences Detection: Our system is capable of detecting multiple divergences within the same timeframe. For instance, it can identify a significant bearish divergence alongside a minor bullish divergence, offering a nuanced view of market dynamics that other indicators might miss.
Extensive Customization Options: DDS provides an array of configuration settings, allowing traders to tailor the detection system to their specific needs. Whether adjusting for sensitivity, timeframes, or specific divergence types, these customization options ensure that the tool can adapt to various trading strategies and preferences.
Our commitment to continuous development means that we regularly update the script based on user feedback, ensuring that it remains at the forefront of trading technology.
How to Use This Script:
Setup: Search for "Wiseball RSI Super Advanced Divergences" in the TradingView indicator library. Easily add the script to your TradingView chart and adjust the settings according to your trading preferences.
Analysis: The script automatically identifies divergences and highlights them on your chart, using color-coded lines and patterns for easy interpretation.
Action: Customize alerts to notify you of new divergences, enabling timely trading decisions based on the script's analysis.
Note: This indicator is best used on a dark background, as it has been optimized for this.
Divergence Style Coding:
Bullish Regular Divergence: Green
Bullish Hidden Divergence: Blue
Bearish Regular Divergence: Red
Bearish Hidden Divergence: Orange
Confirmed Divergence: Solid opaque line
Anticipated Divergence: Dotted line in the type's color
Projected Divergence: Dashed line in the type's color
Understand Technical and practical limitations:
This indicator is designed to facilitate ease of use, correspond to standard practices, and cover your essential needs. DDS options are limited to the essentials for simplicity and ease of use. Moreover, these limitations allow for reduced calculation time and a smooth display.
It is limited to displaying 100 divergences, and the number of bars analyzed is fixed at 960. Use the replay mode to view past divergences.
Divergences sharing the same endpoint are limited to the divergence with the longest duration.
Divergences of the same type that cross or share the same time space are filtered to display only one.
The maximum duration of divergences is set to 120 bars.
Anticipated divergences but not projected ones.
Note: As with all trading tools, it's crucial to use this indicator in conjunction with other indicators and fundamental analysis to validate your trading decisions. Our tools are designed to provide you with valuable insights, not to predict the future. Always conduct your research and trade responsibly.

Pro Trading Art - Head And ShouldersHow the Script Works:
1. The script identifies potential Head and Shoulders patterns by searching for specific pivot highs and pivot lows in the price data.
2. It checks for the presence of a left shoulder, head, and right shoulder based on the conditions defined in the script.
3. If a valid Head and Shoulders pattern is found, the script plots lines and labels on the chart to visualize the pattern.
4. The script also identifies Inverted Head and Shoulders patterns using similar logic but with different conditions.
5. It plots lines and labels for the Inverted Head and Shoulders pattern.
6. The script generates short and long conditions based on the patterns. Short conditions trigger when the close price crosses below the neck level of a Head and Shoulders pattern, while long conditions trigger when the close price crosses above the neck level of an Inverted Head and Shoulders pattern.
7. It plots sell and buy signal shapes on the chart when the short and long conditions are met, respectively.
8. The script can also trigger alerts to notify the user when a valid Head and Shoulders or Inverted Head and Shoulders pattern is detected.
9. The script provides visual cues on the chart to help users identify potential trading opportunities.
10. The logic and parameters of the script can be modified by the user to customize the behavior and adapt it to different trading strategies.
How Users Can Make Profit Using This Script:
1. Identify potential short-selling opportunities: When a valid Head and Shoulders pattern is detected and a short condition is met, it indicates a potential trend reversal. Traders can consider opening short positions to profit from a downward price movement.
2. Identify potential long-buying opportunities: When a valid Inverted Head and Shoulders pattern is detected and a long condition is met, it suggests a potential trend reversal. Traders can consider opening long positions to profit from an upward price movement.
3. Combine with additional analysis: Users can utilize this script as a tool in their overall trading strategy. They can combine the signals generated by the script with other technical indicators, fundamental analysis, or market sentiment to make more informed trading decisions.
4. Define appropriate entry and exit points: Traders can use the lines and labels plotted by the script to determine entry and exit points for their trades. For example, they may choose to enter a short position after the price crosses below the neck level and exit when the price reaches a predetermined target or when the pattern is invalidated.
5. Set risk management measures: It is important for users to implement proper risk management strategies when trading based on the script's signals. They should define stop-loss orders to limit potential losses if the trade goes against them and consider setting profit targets to secure profits when the trade moves in their favor.

Intrabar Efficiency Ratio█ OVERVIEW
This indicator displays a directional variant of Perry Kaufman's Efficiency Ratio, designed to gauge the "efficiency" of intrabar price movement by comparing the sum of movements of the lower timeframe bars composing a chart bar with the respective bar's movement on an average basis.
█ CONCEPTS
Efficiency Ratio (ER)
Efficiency Ratio was first introduced by Perry Kaufman in his 1995 book, titled "Smarter Trading". It is the ratio of absolute price change to the sum of absolute changes on each bar over a period. This tells us how strong the period's trend is relative to the underlying noise. Simply put, it's a measure of price movement efficiency. This ratio is the modulator utilized in Kaufman's Adaptive Moving Average (KAMA), which is essentially an Exponential Moving Average (EMA) that adapts its responsiveness to movement efficiency.
ER's output is bounded between 0 and 1. A value of 0 indicates that the starting price equals the ending price for the period, which suggests that price movement was maximally inefficient. A value of 1 indicates that price had travelled no more than the distance between the starting price and the ending price for the period, which suggests that price movement was maximally efficient. A value between 0 and 1 indicates that price had travelled a distance greater than the distance between the starting price and the ending price for the period. In other words, some degree of noise was present which resulted in reduced efficiency over the period.
As an example, let's say that the price of an asset had moved from $15 to $14 by the end of a period, but the sum of absolute changes for each bar of data was $4. ER would be calculated like so:
ER = abs(14 - 15)/4 = 0.25
This suggests that the trend was only 25% efficient over the period, as the total distanced travelled by price was four times what was required to achieve the change over the period.
Intrabars
Intrabars are chart bars at a lower timeframe than the chart's. Each 1H chart bar of a 24x7 market will, for example, usually contain 60 intrabars at the LTF of 1min, provided there was market activity during each minute of the hour. Mining information from intrabars can be useful in that it offers traders visibility on the activity inside a chart bar.
Lower timeframes (LTFs)
A lower timeframe is a timeframe that is smaller than the chart's timeframe. This script determines which LTF to use by examining the chart's timeframe. The LTF determines how many intrabars are examined for each chart bar; the lower the timeframe, the more intrabars are analyzed, but fewer chart bars can display indicator information because there is a limit to the total number of intrabars that can be analyzed.
Intrabar precision
The precision of calculations increases with the number of intrabars analyzed for each chart bar. As there is a 100K limit to the number of intrabars that can be analyzed by a script, a trade-off occurs between the number of intrabars analyzed per chart bar and the chart bars for which calculations are possible.
Intrabar Efficiency Ratio (IER)
Intrabar Efficiency Ratio applies the concept of ER on an intrabar level. Rather than comparing the overall change to the sum of bar changes for the current chart's timeframe over a period, IER compares single bar changes for the current chart's timeframe to the sum of absolute intrabar changes, then applies smoothing to the result. This gives an indication of how efficient changes are on the current chart's timeframe for each bar of data relative to LTF bar changes on an average basis. Unlike the standard ER calculation, we've opted to preserve directional information by not taking the absolute value of overall change, thus allowing it to be utilized as a momentum oscillator. However, by taking the absolute value of this oscillator, it could potentially serve as a replacement for ER in the design of adaptive moving averages.
Since this indicator preserves directional information, IER can be regarded as similar to the Chande Momentum Oscillator (CMO) , which was presented in 1994 by Tushar Chande in "The New Technical Trader". Both CMO and ER essentially measure the same relationship between trend and noise. CMO simply differs in scale, and considers the direction of overall changes.
█ FEATURES
Display
Three different display types are included within the script:
• Line : Displays the middle length MA of the IER as a line .
Color for this display can be customized via the "Line" portion of the "Visuals" section in the script settings.
• Candles : Displays the non-smooth IER and two moving averages of different lengths as candles .
The `open` and `close` of the candle are the longest and shortest length MAs of the IER respectively.
The `high` and `low` of the candle are the max and min of the IER, longest length MA of the IER, and shortest length MA of the IER respectively.
Colors for this display can be customized via the "Candles" portion of the "Visuals" section in the script settings.
• Circles : Displays three MAs of the IER as circles .
The color of each plot depends on the percent rank of the respective MA over the previous 100 bars.
Different colors are triggered when ranks are below 10%, between 10% and 50%, between 50% and 90%, and above 90%.
Colors for this display can be customized via the "Circles" portion of the "Visuals" section in the script settings.
With either display type, an optional information box can be displayed. This box shows the LTF that the script is using, the average number of lower timeframe bars per chart bar, and the number of chart bars that contain LTF data.
Specifying intrabar precision
Ten options are included in the script to control the number of intrabars used per chart bar for calculations. The greater the number of intrabars per chart bar, the fewer chart bars can be analyzed.
The first five options allow users to specify the approximate amount of chart bars to be covered:
• Least Precise (Most chart bars) : Covers all chart bars by dividing the current timeframe by four.
This ensures the highest level of intrabar precision while achieving complete coverage for the dataset.
• Less Precise (Some chart bars) & More Precise (Less chart bars) : These options calculate a stepped LTF in relation to the current chart's timeframe.
• Very precise (2min intrabars) : Uses the second highest quantity of intrabars possible with the 2min LTF.
• Most precise (1min intrabars) : Uses the maximum quantity of intrabars possible with the 1min LTF.
The stepped lower timeframe for "Less Precise" and "More Precise" options is calculated from the current chart's timeframe as follows:
Chart Timeframe Lower Timeframe
Less Precise More Precise
< 1hr 1min 1min
< 1D 15min 1min
< 1W 2hr 30min
> 1W 1D 60min
The last five options allow users to specify an approximate fixed number of intrabars to analyze per chart bar. The available choices are 12, 24, 50, 100, and 250. The script will calculate the LTF which most closely approximates the specified number of intrabars per chart bar. Keep in mind that due to factors such as the length of a ticker's sessions and rounding of the LTF, it is not always possible to produce the exact number specified. However, the script will do its best to get as close to the value as possible.
Specifying MA type
Seven MA types are included in the script for different averaging effects:
• Simple
• Exponential
• Wilder (RMA)
• Weighted
• Volume-Weighted
• Arnaud Legoux with `offset` and `sigma` set to 0.85 and 6 respectively.
• Hull
Weighting
This script includes the option to weight IER values based on the percent rank of absolute price changes on the current chart's timeframe over a specified period, which can be enabled by checking the "Weigh using relative close changes" option in the script settings. This places reduced emphasis on IER values from smaller changes, which may help to reduce noise in the output.
█ FOR Pine Script™ CODERS
• This script imports the recently published lower_ltf library for calculating intrabar statistics and the optimal lower timeframe in relation to the current chart's timeframe.
• This script uses the recently released request.security_lower_tf() Pine Script™ function discussed in this blog post .
It works differently from the usual request.security() in that it can only be used on LTFs, and it returns an array containing one value per intrabar.
This makes it much easier for programmers to access intrabar information.
• This script implements a new recommended best practice for tables which works faster and reduces memory consumption.
Using this new method, tables are declared only once with var , as usual. Then, on the first bar only, we use table.cell() to populate the table.
Finally, table.set_*() functions are used to update attributes of table cells on the last bar of the dataset.
This greatly reduces the resources required to render tables.
Look first. Then leap.

PriceCatch BOSS IOHi TradingView Community.
I am publishing a script that uses a proprietary logic based on Fibonacci retracement for identifying breakouts. This is a script that focuses on long side trades only.
PriceCatch BOSS IO: - PriceCatch Breakout Screener Script (Invite Only).
This script is not an indicator that plots anything on the chart but is a Screener.
SLIPPED OPPORTUNITIES
One of the problems faced by traders is that while they are watching or studying the chart of one stock or Forex pair, a super opportunity slips by them in another stock or another instrument and it is frustrating when that happens. With the PriceCatch BOSS IO script, you can now capture such moves made by other symbols whilst you are watching some other instrument.
USP:
The uniqueness of this script is that you can screen Nine of your favorite symbols for breakout opportunities simultaneously.
Users can pick Nine symbols of their choice and specify a resolution in the Settings dialog screen that the script will use to find out any probable breakouts in those selected nine symbols continuously.
The symbols could be from any exchange across the world and of any type - stocks, futures, commodities, Forex and Crypto. Simply put, if you can plot the symbol in TradingView, PriceCatch BOSS can monitor that instrument for breakouts on the time interval chosen by you.
ACTIONABLE INFORMATION:
What traders look for and expect from their charts is actionable information. This script does that. It clearly tells you the Entry Price and Stop Loss price for each symbol when a breakout opportunity presents itself in that symbol. You can then open up the chart of that specific symbol to validate the given information with any other indicators that you use and then take the call with regards to a trade. You may also use this script alone without adding any other indicator to your chart. The choice is yours.
CLARITY BEFORE TRADE:
As both Entry Price and Stop Loss Price are identified by the script, you receive advance information about the risk and can set your own Reward based on your personal preferences. So, with the necessary information provided to you in advance, you can plan your trades with clarity.
HOW IT WORKS:
Once the list of symbols are selected and resolution chosen, the script then continuously monitors those given symbols for breakout opportunities. At the close of every interval, it presents the results as shown below:
Results Set
This script shows the results of the screening in a Table as under:
SYMBOL Entry Price Stop Price
TSLA 830.84 802.88
EURUSD 1.13425 1.13160
Similarly for seven more instruments chosen by you.
NOTE: 0.00 under Entry and Stop price columns mean that there is no opportunity in that symbol.
ADVANTAGE:
The advantage of this script is that it helps you spot trades in your favorite symbols without manually loading their charts. With the ability to screen the symbols from Intraday time frames to higher time frames such as Weekly, you will be able to spot opportunities to go long in intraday, swing and even positional trades of longer duration.
Another significant advantage of this script is that while you may be watching a symbol in, say 15 minutes time frame, you can set the script to monitor breakouts in any other higher time frame starting from 15 minutes. This, in effect, gives you unsurpassed advantage.
DISCIPLINE:
As you choose your nine instruments/assets, the script indirectly inculcates discipline as your attention will be only on the selected instruments and you will not be distracted or search for opportunities in a whole bunch of other symbols / assets / instruments. As you can at any time change the set of nine assets as per your personal preference, you get the flexibility that you seek to work with a different set of symbols. For Forex traders who like to monitor only Major Pairs the ability to scan Nine pairs is quite sufficient. Similarly, to traders who trade S&P500, ES1! and other instruments, the nine symbols flexibility is adequate.
LONG POSITION TOOL
For visual cues, you may use the Long Position tool to set the Entry, Stop and Targets as per your preference on the main chart.
TRICK:
Can I only screen nine instruments? What if I am interested to screen more? Actually, you can screen more instruments. You see, you can add this script on to your chart multiple times and can select a set of nine unique stocks per script instance. That way you can actually screen more than nine stocks!
EXAMPLES:
Nifty 50
TSLA
Maruti
USDJPY
MSFT
UI
The script allows you to fine tune display options as per your personal preferences.
NOTE: This script runs in a separate pane without obstructing the view of your main chart.
NOTE: The formatting of price is based on mintick. As a result, since Forex and Crypto have more number of digits after the Decimal, if your screener list consists of a mix of stocks, Forex and Crypto - please change to a Forex chart to get the correct Forex price and to Crypto for correct Crypto price and so on.
NOTE: You will not get accurate results if you are in a higher time frame chart and the Screener resolution is set to lower time frame. For example, if chart is in 15 MTF and Screener resolution is set to 3 MTF, the results may not be accurate.
TIP: If you have added this script multiple times to your chart, then you may have to maximize the pane to view the results table.
NOTE - PRIOR TO USING THIS SCRIPT:
Please remember that the script is shared with absolutely no assurances about usability and any warranties whatsoever and as a responsible trader, please satisfy yourselves thoroughly and use it only if you are convinced it works for you. Remember, you are 100% responsible for your actions and must, therefore, do your due diligence before using this script and also before every trade. Profits and losses are part and parcel of trading activity and you are solely responsible for both. If you understand and accept that, you may use the script.
QUERIES/FEEDBACK
Please PM me.
Hope you find this script useful. Wish everyone all the best with trading.
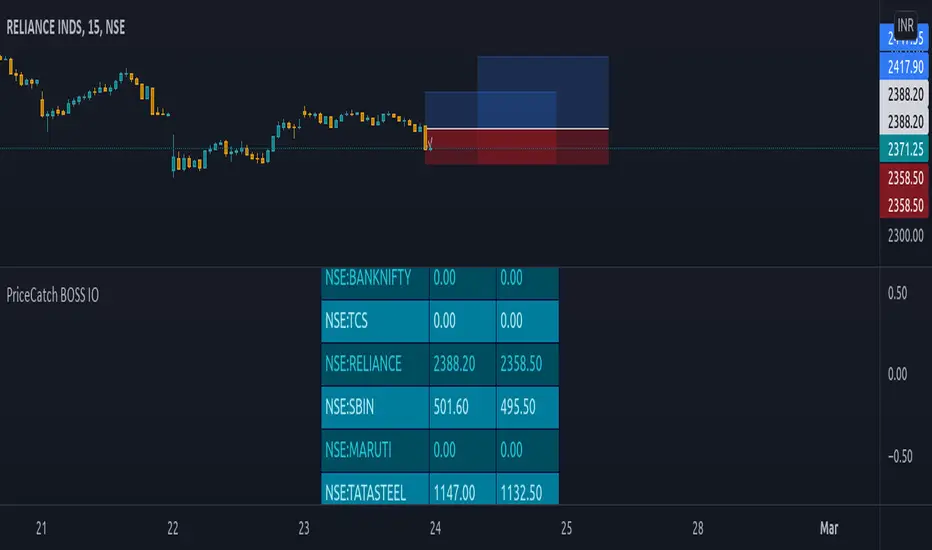
3Commas DCA Bot Indicator v1.0Introduction
The indicator attempts to implement a majority all of the settings found on the 3Commas DCA Bot setting page that can be implemented within a TradingView indicator. Specifically, it will implement the "Open new trade ASAP" and "Trading View Custom Signal" deal start conditions. In this way, you can leverage the power of TradingView's backtester to model your settings and analysis past performance as well as leverage TradingView's alert notification subsystem to send Deal Start and Close signals to 3Commas using almost any of the thousands of scripts found in the Public Library (see "What does it do and how does it do it?" section below for more information on how to do this using the RSI indicator as an example).
How is it original and useful?
This indicator is unique in that it's the only one (as of the initial publications) that can handle 28 out of 32 bot settings (88% coverage) that are found on the 3Commas bot settings page. In addition, because it is a TradingView script, you will benefit from the following:
Model your bot's configuration using the backtester on any timeframe and evaluate its performance using the chart's history.
View a table of detailed statistics pertaining to deals started and completed, win/loss rates, daily P&L, true max drawdown, and detailed statistics on bars in deal along with safety orders filled.
View a table of "Used amount for each step" as presented in 3Commas as well.
Ability to link to almost any TradingView chart indicator that provides a single data point for buy/sell signals.
Make use of the 3Commas TA Start Conditions indicator to emulate the 3Commas built-in indicators for further performance evaluation with the backtester.
How does it compare to other scripts in the Public Library?
This indicator offers a very detailed, comprehensive settings and maybe the only one (as of the initial publication) that can handle 28 out of the 32 bot settings that are found on the 3Commas bot settings page (that can be handled within TradingView, because some cannot be modeled due to chart and language constraints). Specifically, the following 3Commas bot settings and inputs are addressed with asterisks denoting specific limitation due to TradingView's platform architecture and/or constraints:
Main settings
✅ Name
❌ Exchange* (Not handled since it is inherited from chart)
⚠ Bot type* (Only Single-pair because you simply apply the indicator to as many pairs you desire in separate charts to simulate a Multi-pair setting)
Pairs
❌ Pairs* (Not handled since it is inheriting the symbol from the chart)
Strategy
✅ Strategy
❌ Profit currency* (Not handled since there is no equivalence in TradingView)
✅ Base order size / unit
✅ Safety order size / unit
✅ Start order type
Deal start condition
⚠ TradingView* (You can modify the "Technical Rating" indicator by TradingView to output a signal yourself like @TheTradingParrot has done in the TV signal for DCA backtest script)
⚠ QFL* (See Quickfingers Luc's Base Breaking Strategy v2.5 - 3Commas Edition for an alternative)
❌ Manually/API* (Not handled since there is no equivalence in TradingView)
✅ Trading View custom signal
✅ Open new trade asap
Take profit
✅ Take profit (%)
✅ Take profit type
✅ Trailing
⚠ Trailing deviation* (modified to handle TradingView's broker emulator properly)
Stop loss
✅ Stop Loss (%)
✅ Stop Loss action
⚠ Stop Loss timeout* (modified to use "bars" as the unit of measure)
Safety orders
✅ Max safety trades count (a total of 100 safety orders are supported!)
⚠ Max active safety trades count* (Not handled since there is no equivalence in TradingView)
✅ Price deviation to open safety orders (% from initial order)
✅ Safety order volume scale
✅ Safety order step scale
Advanced settings
✅ Don't start deal(s) if the daily volume is less than
✅ Minimum price to open deal
✅ Maximum price to open deal
⚠ Deal start delay (QFL and standard TV signals only)* (modified to use "bars" as the unit of measure)
✅ Cooldown between deals
✅ Open deals & stop
Close deal after timeout
⚠ The time after which, deal will be closed automatically* (modified to use "bars" as the unit of measure)
In addition to the above inputs, the script will also support the same output data points that are found on the bot settings page, which are:
Assistant
✅ Balance
✅ Max amount for bot usage (Based on current rate)
✅ Max safety order price deviation
✅ % of available balance to be used by the bot
Table (Used amount for each step)
✅ Order No.
✅ Deviation %
✅ Order Size (Base currency)
✅ Order Volume (Quote currency)
✅ Price
✅ Average price
✅ Required price
✅ Required change
✅ Total Size (Base currency)
✅ Total Volume (Quote currency)
What does it do and how does it do it?
When applied to the chart for the first time, the default settings will work to execute the "Open new trade asap" deal start condition using a take profit of 4%, a base order size of 1.335% of equity (initial capital + net profit), a safety order size of 2.003% of equity (initial capital + net profit), a safety order volume scale of 1.5, a safety order step scale of 1.21, and a max safety trades count of 8. With these settings, as you scroll through the chart's history you should see price action crossing the DCA layers (denoted with blue triangles), and a green take-profit price line will render (with green triangle denoting the crossings). Lastly, in the upper-right corner of the chart the table of DCA statistics will render showing you all the gathered data that took place since the chart's starting history until the current time.
Using the "TV Custom Signal" section will allow you to "link" other chart indicators to supply "Start" and "Close" signals for the script. For example, here's how you can use the standard RSI indicator to generate an entry signal:
1) Add the stock RSI indicator and configure it to your desire.
2) Select the "RSI" indicator in the "Chart/Indicator Data Point" input.
3) Select "Chart/Indicator Data Point" in the "Start Deal When" input.
4) Select "Less Than" in the "Is" input.
5) Select "Custom Value(s)" in the "The Value Of" input.
6) Enter "25" in the "Custom Value 1 (Single or Lower Bound)" input.
7) Select "Trading View Custom Signal" in the "Open new trade" input (in the DEAL START CONDITION section).
8) Lastly, check the checkbox with a horizontal straight line above the "Start Deal When" input.
This means that the indicator will start a deal when the "RSI indicator" is "Less Than" the value of "25".
Strategy Results
The default settings are designed to ensure that the indicator will render chart elements when first loaded as well as to allow the backtester to gather order executions and display performance summary. The chart above is is using $10,000 initial capital, a commission rate of 0.1% for both entries and exits, and a 1 tick slippage setting. It is also using 3.22581% of the equity for the Base Order Size, 6.45161% of equity for the first Safety Order Size. The Maximum Safety Trade Count is 4 with a Safety Order Volume Scale of 2, a Safety Order Step Scale of 1.53, Price Deviation To Option Safety Orders at 5.3, and a take profit of 4.5% with Trailing turned on at a deviation of 1.5%. All other settings are defaults.
It is recommended that the indicator be "tuned" for your specific market in order to best implement the strategy and obtain better desirable results. You do so by using the backtester and statistics table and observe the output values and learn how the indicator is performing in the chart history. Using this information, you can adjust the settings accordingly until you find the settings acceptable to your trading goals and risk tolerance.
Always keep in mind that past performance may not be indicative of future results. Settings that seem favorable for one market may be found to be disastrous in another. Therefore, do take the time needed to understand how the settings will behave with the given chart symbol.
Enjoy! 😊👍
How to obtain access to the script?
You have two choices:
Use the "Website" link below to obtain access to this indicator, or
Send us a private message (PM) in TradingView itself.

Matrix Library (Linear Algebra, incl Multiple Linear Regression)What's this all about?
Ever since 1D arrays were added to Pine Script, many wonderful new opportunities have opened up. There has been a few implementations of matrices and matrix math (most notably by TradingView-user tbiktag in his recent Moving Regression script: ). However, so far, no comprehensive libraries for matrix math and linear algebra has been developed. This script aims to change that.
I'm not math expert, but I like learning new things, so I took it upon myself to relearn linear algebra these past few months, and create a matrix math library for Pine Script. The goal with the library was to make a comprehensive collection of functions that can be used to perform as many of the standard operations on matrices as possible, and to implement functions to solve systems of linear equations. The library implements matrices using arrays, and many standard functions to manipulate these matrices have been added as well.
The main purpose of the library is to give users the ability to solve systems of linear equations (useful for Multiple Linear Regression with K number of independent variables for example), but it can also be used to simulate 2D arrays for any purpose.
So how do I use this thing?
Personally, what I do with my private Pine Script libraries is I keep them stored as text-files in a Libraries folder, and I copy and paste them into my code when I need them. This library is quite large, so I have made sure to use brackets in comments to easily hide any part of the code. This helps with big libraries like this one.
The parts of this script that you need to copy are labeled "MathLib", "ArrayLib", and "MatrixLib". The matrix library is dependent on the functions from these other two libraries, but they are stripped down to only include the functions used by the MatrixLib library.
When you have the code in your script (pasted somewhere below the "study()" call), you can create a matrix by calling one of the constructor functions. All functions in this library start with "matrix_", and all constructors start with either "create" or "copy". I suggest you read through the code though. The functions have very descriptive names, and a short description of what each function does is included in a header comment directly above it. The functions generally come in the following order:
Constructors: These are used to create matrices (empy with no rows or columns, set shape filled with 0s, from a time series or an array, and so on).
Getters and setters: These are used to get data from a matrix (like the value of an element or a full row or column).
Matrix manipulations: These functions manipulate the matrix in some way (for example, functions to append columns or rows to a matrix).
Matrix operations: These are the matrix operations. They include things like basic math operations for two indices, to transposing a matrix.
Decompositions and solvers: Next up are functions to solve systems of linear equations. These include LU and QR decomposition and solvers, and functions for calculating the pseudo-inverse or inverse of a matrix.
Multiple Linear Regression: Lastly, we find an implementation of a multiple linear regression, including all the standard statistics one can expect to find in most statistical software packages.
Are there any working examples of how to use the library?
Yes, at the very end of the script, there is an example that plots the predictions from a multiple linear regression with two independent (explanatory) X variables, regressing the chart data (the Y variable) on these X variables. You can look at this code to see a real-world example of how to use the code in this library.
Are there any limitations?
There are no hard limiations, but the matrices uses arrays, so the number of elements can never exceed the number of elements supported by Pine Script (minus 2, since two elements are used internally by the library to store row and column count). Some of the operations do use a lot of resources though, and as a result, some things can not be done without timing out. This can vary from time to time as well, as this is primarily dependent on the available resources from the Pine Script servers. For instance, the multiple linear regression cannot be used with a lookback window above 10 or 12 most of the time, if the statistics are reported. If no statistics are reported (and therefore not calculated), the lookback window can usually be extended to around 60-80 bars before the servers time out the execution.
Hopefully the dev-team at TradingView sees this script and find ways to implement this functionality diretly into Pine Script, as that would speed up many of the operations and make things like MLR (multiple linear regression) possible on a bigger lookback window.
Some parting words
This library has taken a few months to write, and I have taken all the steps I can think of to test it for bugs. Some may have slipped through anyway, so please let me know if you find any, and I'll try my best to fix them when I have time to do so. This library is intended to help the community. Therefore, I am releasing the library as open source, in the hopes that people may improving on it, or using it in their own work. If you do make something cool with this, or if you find ways to improve the code, please let me know in the comments.

TE REKABThis indicator is the combination of RECAT & REVVIND published earlier with some extra features.
Core idea behind designing this tool is to IDENTIFY & TRADE REVERSALS in the live market. Reversal can be a TREND REVERSAL or a TEMPORARY PULL BACK. This tool works perfectly in both situations.
LOGIC:
Reversals are identified using:
- failure to break through long term support & resistance, pivots & daily H/L
- volume divergence
- orderflow concept of "skipping of prices".
- flow of price against the momentum during a trend.
Plots are 21/50/100 EMAs which are colour coded to represent the current trend.
ROYAL-BLUE CANDLES represent "ACTION CANDLES"; the high probability candles for finding best reversal trades.
HOW TO USE:
AFTER YOU APPLY THE SCRIPT.
1. WAIT FOR THE FORMATION NEON-BLUE/YELLOW COLOURED BARS AT/NEAR DAY HIGH/LOW.
Accuracy is highest when the REVERSALS are caught at/near DAY HIGH/LOW. I would suggest you to work only on near DAY HIGH/LOW candles.
Do not jump into the trade. Wait for the candle to close.
2. NEON-BLUE represents the start of a BEARISH TREND or simply "SELL SIGNAL".
YELLOW represents the beginning of a BULLISH TREND or simply "BUY SIGNAL".
3. If the NEON-BLUE candle is formed at/near DAY HIGH.
SELL below it's LOW with DAY HIGH as Stoploss. (Keep some BUFFER).
If the YELLOW candle is formed at/near DAY LOW.
BUY above it's HIGH with DAY LOW as Stoploss. (Keep some BUFFER).
4. TARGET
Risk : Reward = 1:1
Trail Stoploss for 1:2, 1:2.5, 1:3
NOTE:
REKAB can be used in any timeframe. However, lower timeframes tend to have more noise as compared to 15mins and above.
REKAB can be used with all the SCRIPTS. However, high volume scripts give better results.
THERE IS ABSOLUTELY NO REPAINTING AFTER THE CANDLE IS CLOSED.
THIS IS A PAID SCRIPT. FOR ACCESS PLEASE SEND A PRIVATE MESSAGE OR WHATSAPP ME (NUMBER IN SIGNATURES)
AS PER TRADINGVIEW POLICY, PLEASE DO NOT ASK FOR ACCESS IN COMMENTS SECTION.
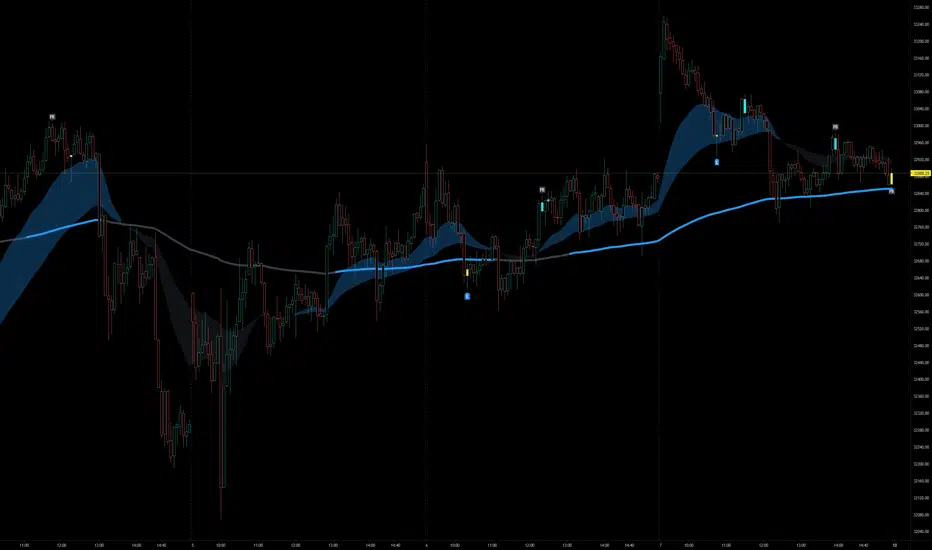
[PX] External LevelHello everyone,
today I'd like to share a script, which enables you to use external logic to plot levels on your chart.
How does it work?
The concept is based on two scripts. One script, which uses an external input as a trigger to print a new level and one script that calculates an output, which will be fetched.
Sounds complicated? It really is not! Let's take a closer look.
// This source code is subject to the terms of the Mozilla Public License 2.0 at mozilla.org
// © paaax
//@version=4
study("RSI OS/OB")
l = input(14, "RSI Length")
ob = input(70, "Overbought")
os = input(30, "Oversold")
r = rsi(close, l)
hline(ob)
hline(os)
plot(r, "RSI", color=color.orange)
// The following plot produces an output, which will be fetched the "External Level"-script.
// It evaluates to one of the following three values: 1.0, -1.0 or 0.0
plot(crossover(r, ob) ? 1.0 : crossunder(r, os) ? -1.0 : 0.0, "Output", transp=100)
The example script above uses an RSI and two threshold levels (70 and 30). The logic here is, that whenever the RSI is crossing down the lower threshold or crossing up the upper threshold we'd consider the current movement to be either oversold or overbought. Therefore, it's a point of interest, which we could visualize with a level.
The script creates an output when the crossover or crossunder of a threshold happens. A crossover would result in a value of 1.0, a crossunder in a value of -1.0. In all other cases the value would be 0.0.
The output of the RSI script would then be used as an input of the External Level script, which has a "Source"-parameter in its input-section. If the fetched input shows 1.0, then the script prints a resistance level. If it shows -1.0 a support level will be printed. And that's basically it. A very simple approach to print levels on your chart with an infinite number of use cases.
For example, you could use fetch outputs from a MACD script, MA script, outputs based on volume or price movement. Just remember the output has to evaluate to either 1.0 or -1.0 and has to be selected in the input-section.
Hope that might be useful to some of you :)
Please click the "Like"-button and follow me for future open-source script publications.
If you are looking for help with your custom PineScript development, don't hesitate to contact me directly here on Tradingview or through the link in my signature :)

Trend Lines Pro for IndicatorsHello Traders!
We need to make things better & better to solve the puzzle and I try to do my best on this way. now I am here with my new Trend Lines Pro for Indicators script.
As you know, Trend Lines is very subjective and many people (even professionals) draw different Trend Lines on the same chart. This is confusing and there must be an automation to make the life easer. with this tool I tried to automate it.
The idea in this script is different from my previous trend lines scripts. In this, I use channel idea so it can check number of pivot points it contains. it also checks the angle while choosing trend lines. then we get stronger and useful Trend Lines automatically.
There are some option in the script, let see one by one:
Indicator: the indicator on which you want to see Trend lines, Predefined Indicators are: RSI, CCI(Commodity Channel Index), OBV(On-Balance Volume), Momentum, MACD, CMF(Chaikin Money Flow), External Indicator
External Indicator: with this option you can use other indicators as input and get trend lines for them.
- First add an indicator (such as MFI)
- in "Indicator" option select "External Indicator"
- click "External Indicator" option
- and choose the indicator from the list
Pivot Period: The Length to calculate Pivot Highs/Lows
Threshold Rate: This rate is used for channel width. it you give bigger numbers then you get bigger channels. it's 4 by default
Minimum Angle Rate for new Trendline: if there are different trend lines , there must be an angle between them to choose best trend lines . you can set the angle with this option.
Minimum Strength: there can be many trend lines but we need to choose/use stronger ones. with this option you can set the number of pivot points a trend channel have to contains. default value is 2
Maximum Loopback Length : by default the script can check 40 pivot highs and 40 pivot lows but to make the script faster and useful I needed to add a limitation for the number of bars that the script can go back.
Show Trendlines as: you can see trend lines as "Trendline", "Channel", "Trend Channel". you can see examples below.
Enable Weak Trend Lines : if there is no trend lines strong enough (as defined in "Minimum Strength" option) you have option to see a weak trend line . that is useful sometimes. if you enable this option weak lines are shown as dotted lines.
Show Price Labels on Trendlines: the script can show the price levels to break trend lines . the example
Line Style: trend lines can be Solid or Dashed as you wish
Color theme: colors of the Up/Down Trend lines can be set. Red, Lime, Blue, White, Black, Olive, Gray
Indicator color: colors of the Up/Down Trend lines can be set. Red, Lime, Blue, White, Black, Olive, Gray and Yellow
and last options are for length options for RSI, CCI, Momentum, MACD, CMF
There are many alerts such: Support/Resistance Broken, Price in Support/Resistance channel, Support/Resistance line broken but still in a channel that means it broke S/R but there is another trend lines to break.
Below an example how the script uses external indicator as input and draws trend lines on it. in this example chaikin ossilator was added to the chart and get trend lines for it. (I am going to make a short video about it)
An example of Trend Channel is below. when you use trend channel option you can get "big picture" of whats going on
An example for trend lines in channels, that is the idea behind this trend lines script
An axample for trend lines for CCI:
Trend lines on OBV:
Trend lines on Momentum:
Trend lines on MACD:
Trend lines on CMF:
Different colors and line styles:
Please send me message for access and do not hesitate to ask your questions about this tool.
Enjoy!
DISCLAIMER: No sharing, copying, reselling, modifying, or any other forms of use are authorized for our documents, script / strategy, and the information published with them. This informational planning script / strategy is strictly for individual use and educational purposes only. This is not financial or investment advice. Investments are always made at your own risk and are based on your personal judgement. I am not responsible for any losses you may incur. Please invest wisely.
付费脚本

Trend Lines ProHello Traders!
We need to make things better & better to solve the puzzle and I try to do my best on this way. now I am here with my new Trend Lines Pro script.
As you know, Trend Lines is very subjective and many people (even professionals) draw different Trend Lines on the same chart. This is confusing and there must be an automation to make the life easer. with this tool I tried to automate it.
The idea in this script is different from my previous trend lines scripts. In this, I use channel idea so it can check number of pivot points it contains, it checks H/L/C in the channels as well. it also checks the angle while choosing trend lines. then we get stronger and useful Trend Lines automatically.
There are some option in the script, let see one by one:
Pivot Period: The Length to calculate Pivot Highs/Lows
Source : Option to use "High/Low" or "Close" as the source for Pivot Points
Threshold Rate : This rate is used for channel width. it you give bigger numbers then you get bigger channels. it's 4 by default
Minimum Angle Rate for new Trendline: if there are different trend lines, there must be an angle between them to choose best trend lines. you can set the angle with this option.
Minimum Strength: there can be many trend lines but we need to choose/use stronger ones. with this option you can set the number of pivot points a trend channel have to contains.
Maximum Loopback Length: by default the script can check 40 pivot highs and 40 pivot lows but to make the script faster and useful I needed to add a limitation for the number of bars that the script can go back.
Show Trendlines as: you can see trend lines as "Trendline", "Channel", "Trend Channel". you can see examples below.
Enable Weak Trend Lines: if there is no trend lines strong enough (as defined in "Minimum Strength" option) you have option to see a weak trend line. that is useful sometimes. if you enable this option weak lines are shown as dotted lines.
Show Price Labels on Trendlines: the script can show the price levels to break trend lines. the examples are below
Line Style: trend lines can be Solid or Dashed as you wish
Color theme: colors of the Up/Down Trend lines can be set. 'Red', Lime, Blue, White, Black, Olive, Gray
you can see the Trend Lines as channels:
you can see Trend Channels to see the big picture.also there is dotted trend line as weak trend line defined above.
you can set color/width of trend lines as you wish.
the script is fast enough to run on 1sec chart:
you can use this script on any chart, fx pairs, stocks, indices etc
I made a short video to explain how to use it and some options:
Please PM for access.
Enjoy!
DISCLAIMER: No sharing, copying, reselling, modifying, or any other forms of use are authorized for our documents, script / strategy, and the information published with them. This informational planning script / strategy is strictly for individual use and educational purposes only. This is not financial or investment advice. Investments are always made at your own risk and are based on your personal judgement. I am not responsible for any losses you may incur. Please invest wisely.
付费脚本

TradeChartist Plug and Trade™TradeChartist Plug and Trade is an extremely useful indicator that can be connected to almost any Study script (not a Strategy) on Trading View (with an Oscillatory or Non-Oscillatory Signal plot) to generate Trade Signals with Stop Loss plot, user set or automatic Target plots and create Alerts based on Past Performance, determined by Past Gains/Drawdowns for each Trade. The indicator is packed with a lot of features including TradeChartist's signature Dashboard and Real-time Gains Tracker, Automatic Targets Generator, Take Profit recommendation, option to paint price bars based on Trade/Price Trend, 3 types of Stop Loss plots to choose from, with option for user to set fixed Target to take profits.
1. How does ™TradeChartist Plug and Trade connect to another Study script/indicator signal?
Plug and Trade is elegantly designed with simplicity in mind, without compromising on functionality, so any trader - beginner to advanced, can just plug an external signal to the indicator with ease by just following these simple steps.
Add to price chart, the Indicator along with the signal plot to be tested and assessed for performance.
Plug the signal into ™TradeChartist Plug and Trade by choosing it from the Plug Signal Here drop-down.
Choose Signal type as Oscillatory if signal oscillates between set values or crosses a certain value periodically (Example: RSI, CCI, TRIX etc that are mostly not overlayed on Price chart and may be in a separate pane from price chart as it may not fit on Price scale), Choose Signal Type as Non Oscillatory if the signal can be plotted on price scale and Trades are normally generated when price crosses above or below it (Moving Averages, SAR indicators like SuperTrend, etc.).
For oscillators, default Oscillator value for Trade Signals is 0 as most Oscillators have 0 as their mid point. The value can be changed if the Signal doesn't oscillate with 0 as its mid point. For example, if the connected Signal is RSI, the values can be changed to Upper and Lower band values to generate Trade Signals.
Plot the Signal on chart if the signal is Non Oscillatory.
2. How can the plugged Signal's performance be assessed using ™TradeChartist Plug and Trade and subsequently used for generating Trade Entries and to create Alerts?
Once the Signal is plugged into the indicator based on steps above, Plug and Trade automatically plots the Trade entries based on the Signal type.
Plot Trade Entries after Bar Close from settings can be checked for signals that do not confirm until bar close. By doing this, repainting can be avoided for most signals and true performance can be assessed. Also, alerts can be created using Once Per Bar rather than Once Per Bar Close .
The real-time Gains Tracker and Dashboard are useful in tracking gains and other useful indicator values like RSI, Stoch, ATR and EMA in real-time with price movement.
Enabling Past Performance from settings will plot Maximum Gains achieved and Maximum Drawdown for each trade as labels . Trading View only plots finite number of labels and old labels are deleted automatically. But to access past performance beyond the last available label, bar replay can be used.
User can choose from 3 types of Stop Losses from the settings - Fixed %, Trailing % and ATR Stop Loss namely and a Fixed TP % to create plots on price chart and to create alerts.
If the user prefers automatic targets based on Trade entries, Recommend Targets can be enabled from the settings. The automatic targets are generated at the time of Trade Entry, along with Target prices and % which turn green when hit.
Each BUY and SELL Trade are tracked in its entirety and the highest high since BUY and lowest low since SELL are plotted on the price chart and also displayed on the Plug and Play Dashboard
Choppiness can be easily spotted if there are numerous Past Performance labels or several Trade Entries around a short timeframe on chart. This may mean that the signal needs smoothing or may not be suitable for the asset to trade on the chart timeframe. Suitability of a Study script for the asset can be determined in many ways using this indicator.
3. What other features are included in ™TradeChartist Plug and Trade?
Enabling Spot Price Bars to take Profit option from settings automatically plots $ sign above/below candles where Profit taking is recommended or Stop Loss moved to secure profits/reduce loss.
Enabling Paint Price Bars with Trade Trend paints price bars with colors that help picture Trade/Price trend. Trend spotting using this works best with (bars/hollow candles/candles with no border) on dark background.
Both features work on Price chart even without any Signal plugged in.
===================================================================================================================
Example Charts using different Signals plugged into ™TradeChartist Plug and Trade
1. RSI Signal (Oscillatory) plugged in with >60 for BUYs and <40 for SELLs - BTC-USDT on 1hr
2. PowerTracer Signal (Oscillatory) plugged in - GBP-USD 1hr
3. 55 period VWMA Signal (Non Oscillatory) plugged in - ADA-USDT 4hr
4. RSI Signal (Oscillatory) plugged in with >70 for BUYs and <30 for SELLs - SPX 1hr with Trailing SL - 3% and TP - 2%
===================================================================================================================
This is not a free to use indicator. Get in touch with me (PM me directly if you would like trial access to test the indicator)
Premium Scripts - Trial access and Information
Trial access offered on all Premium scripts.
PM me directly to request trial access to the scripts or for more information.
===================================================================================================================
